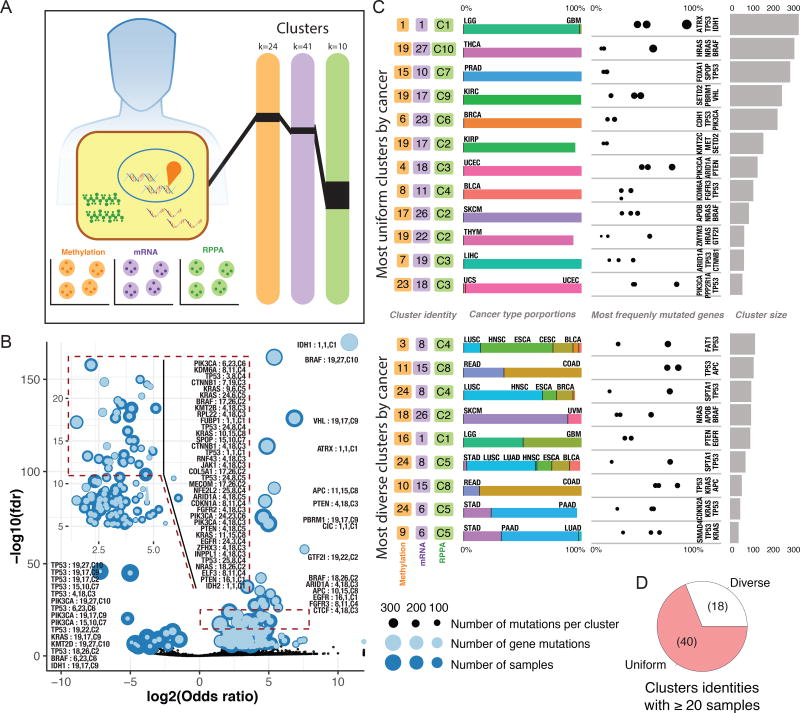
Figure 6. Complexities of multi dimensional molecular evaluation.
A Clustering analysis was performed using 3 substrates: methylation, mRNA, and RPPA. Samples divided into 24 methylation clusters, 41 mRNA, and 10 RPPA clusters. Links show each tumor was given a unique cluster combination identifier. B Gene enrichment analysis for each cluster assignment is displayed as a volcano plot. Dashed square is enlarged in an inset. Overlapping dots show number of samples in the cluster assignment (dark blue) and the number of samples with a given mutation superimposed (light blue), jointly indicating the mutated proportion in that cluster. C The 21 most gene enriched cluster identities, with breakdown by tissue type proportion and most frequently mutated gene from that cluster identity. Sample size for each identity appears in bar plot. D The 58 cluster identities having ≥20 samples. Pie chart illustrates fraction of uniform clusters, where 90% of samples within a cluster are from a single cancer type.

