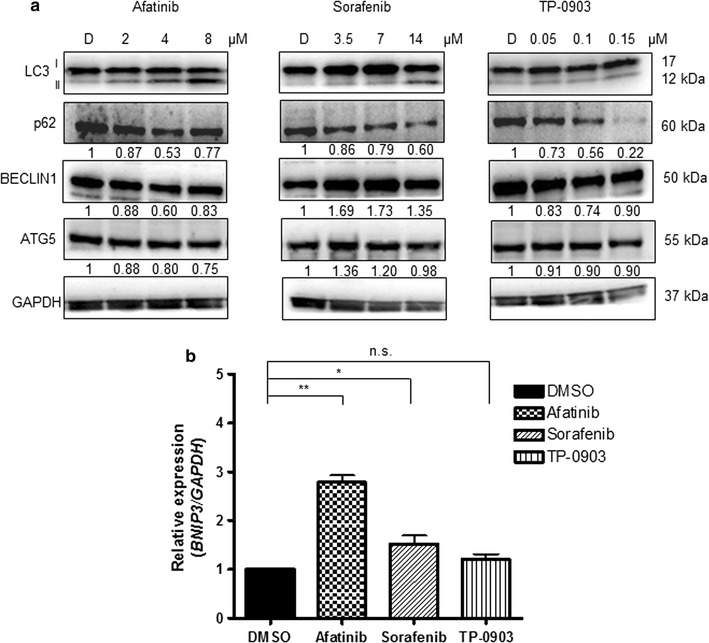
Fig. 1.

Expression of autophagy regulators upon treatment. a Increasing concentrations of Afatinib, Sorafenib and TP-0903 were used for the treatment of SH-SY5Y cells for 24 h (upper numbers indicate the concentrations used in μM; D = DMSO). Levels of main autophagy regulators were evaluated by western blot. GAPDH served as a loading control protein. Numbers under the single protein indicate relative expressions obtained by densitometry measurement, normalized to GAPDH, and compared to the control samples (DMSO = 1). b Real-time quantitative PCR (qPCR) was employed for the evaluation of BNIP3 mRNA level 24 h post-treatment, with the median value from the concentrations defined for each RTKi. GAPDH was used as the housekeeping gene. Relative quantification (RQ) was done after normalizing a single Cq to the Cq of GAPDH, and ΔΔCq method was then applied to calculate the relative expression in treatments with respect to DMSO treated control. Results are presented as mean ± SD of three independent experiments, and p value marked as *p < 0.05; **p < 0.01; ns non-significant
