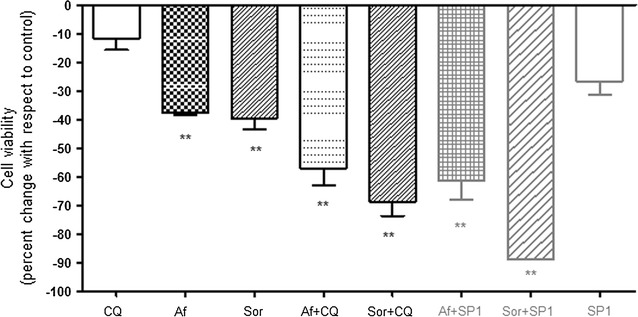
Fig. 4.

Cell viability assessment upon single and combined treatments. Trypan-blue exclusion assay was applied for the evaluation of the cell viability 24 h post-treatment with single RTKi or in combination with CQ and SP1. The percent change measured with respect to DMSO control (DMSO percent change = 0) is shown. Results are presented as mean ± SD out of triplicates, and p value marked as **p < 0.01; ns non-significant (Dunnett’s test done using CQ value as a control for the multiple comparison). CQ Chloroquine, SP1 Spautin-1, Af Afatinib, Sor Sorafenib
