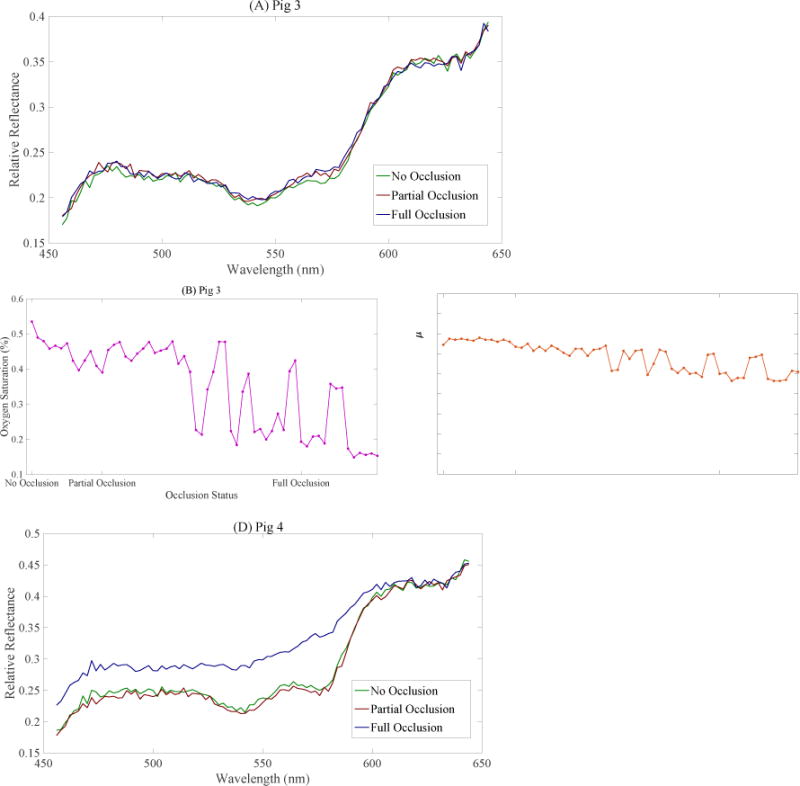
Figure 6.


(A) Pig 3 DRS spectra representative of three different occlusion statuses. (B) Estimated oxygen saturation during first half of occlusion study on Pig 3 (C) Total Hb concentration estimated during first half of occlusion study on Pig 3. (D) Pig 4 DRS spectra representative of three different occlusion statuses. (E) Estimated oxygen saturation during first half of occlusion study on Pig 4 (F) Total Hb concentration estimated during first half of occlusion study on Pig 4.
