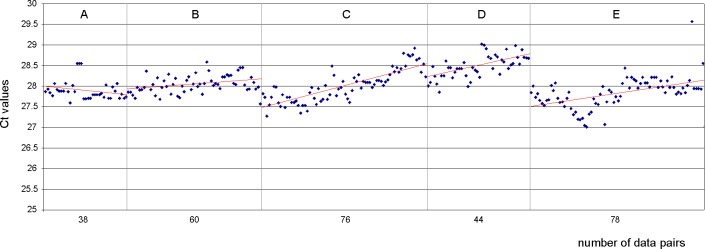
Fig 2.
Visualization of decay in the life span of five consecutive working solutions (A-E) of the pME-2 standard dilution 4000. The Ct drift due to molecule degradation is shown by the increasing Ct values and is visualizes by the linear regression lines (red). For noise reduction and a more compact image size data point calculations were based on the mean of duplex PCR reactions.

