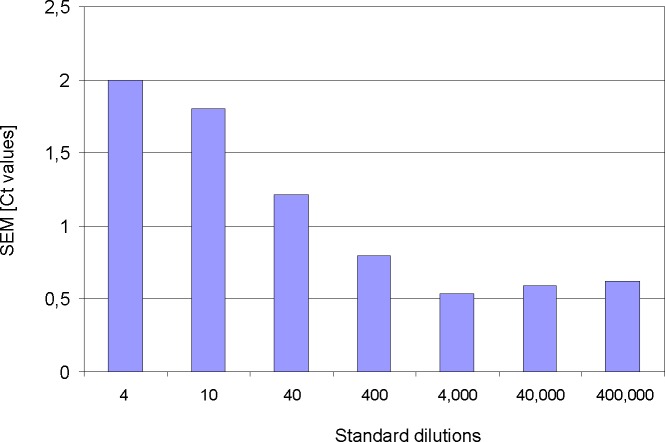
Fig 3. Inter-experimental variance for the seven pME-2 standard dilutions.
Calculated were performed from 387 consecutive PCR experiments. Numbers on the x-axis correspond to the amounts of pME-2 plasmid molecules that serve as target within the respective PCR reactions. Decreasing numbers of target molecules inversely correlate with standard error of mean (SEM given in Ct values) due to pipetting inaccuracy.

