Figure 2.
Adult CPCs Produce Functional Cardiomyocytes In Vitro and In Vivo
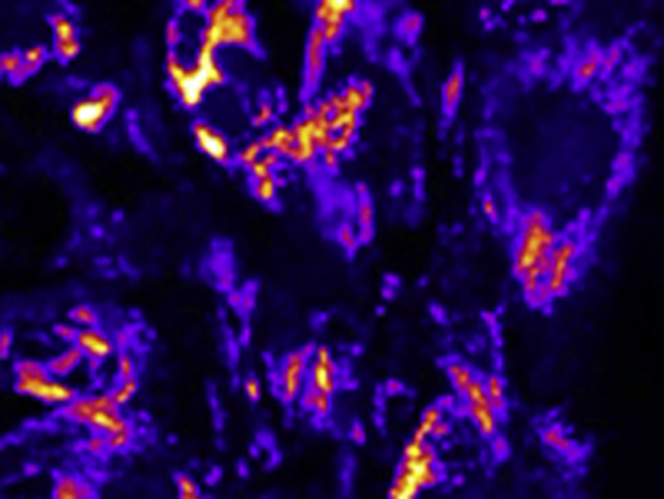
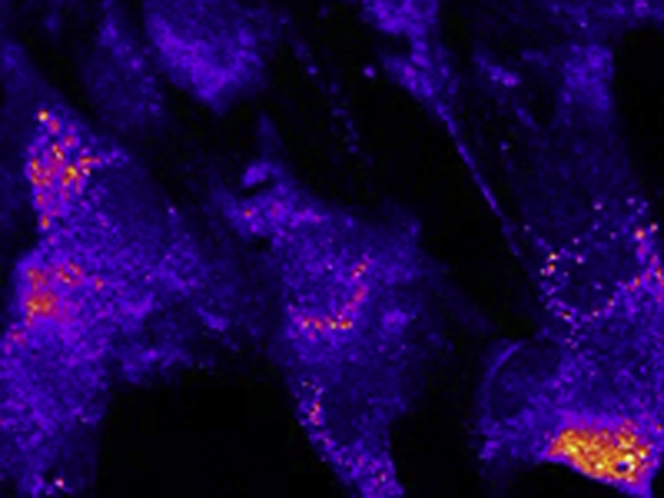
(A) Expression of calcium handling proteins (CAV1.2, RYR2, SERCA2B) in proliferating CPCs (Expansion; black) and in adult CPCs exposed to DLL1 (gray), and differentiated in the absence or presence of DAPT. Data represent mean ± SEM; *p < 0.05 as compared with proliferating CPCs; ‡p < 0.05 as compared with differentiating unstimulated (None; white) CPCs in absence of DAPT (n = 4). (B) Cytosolic Ca2+ signals were recorded in adult CPCs in expansion (upper panels), and in differentiating CPCs following exposure or not to DLL1 in the presence of DAPT. Cells were either evaluated under resting conditions or electrical stimulated (10 s at 0.5 Hz). Scale bar: 50 μm. Representative tracing of normalized Ca2+ changes obtained following induction of pacing (arrow). Colored lines correspond to regions of recording as indicated in B. Images depicted in B were taken at the indicated time (*). See Videos 1 and 2. (C) Quantification of calcium transient parameters. Data represent mean ± SEM; *p < 0.05 as compared with proliferating CPCs; ‡p < 0.05 as compared with differentiating unstimulated (None) (white) CPCs in absence of DAPT (n = 55 cells per quantification). (D) Analysis of h-LAMIN (red) and α-ACTININ expression (green) in human CPC-derived cardiomyocytes in SCID mouse heart sections by immunostaining. DLL1-stimulated CPCs were injected in neonatal SCID mice. Mice were injected with DAPT or vehicle alone. Nuclei were stained with DAPI (blue). Scale bars: 20 μm. (E) High magnification of human hLAMINPOS α-ACTININPOS cardiomyocytes in the mouse myocardium. Scale bars: 20 μm. (F) Quantification of human hLAMINPOS cardiomyocyte patches in SCID mouse hearts. Data represent mean ± SEM; *p < 0.05 as compared with control group (unstimulated CPCs [None]; No DAPT administration); ‡p < 0.05 as compared with the group of animals injected with CPCs exposed to DLL1 (gray), but not injected with DAPT (minimum 3,000 cells in 40 different fields at a magnification of 40× per quantification, 3 animals per condition). (G) Confocal analysis and tridimensional reconstruction of a representative patch of human cardiomyocytes in the mouse myocardium. (a) Confocal image of a representative patch. Scale bars: 20μm. (b and c) Tridimensional reconstruction of the representative human cardiomyocyte depicted in a. hLAMIN (red), α-ACTININ expression (green), DAPI (blue). Scale bar: 5 μm. (d and e) High magnifications of areas indicated in b and c. Scale bar: 20 μm. Abbreviations as in Figure 1.
Electrical stimulation of CPC-derived smooth muscle cells. Related to Figure 2. Cytosolic Ca2+ signals were recorded in differentiated adult CPCs, not exposed to DLL1 in the absence of DAPT. Cells were evaluated following electrical stimulation (10 s at 0.5 Hz).
Electrical stimulation of CPC-derived cardiomyocytes. Related to Figure 2. Cytosolic Ca2+ signals were recorded in differentiated adult CPCs, following exposure to DLL1 in the presence of DAPT. Cells were evaluated following electrical stimulation (10 s at 0.5 Hz).


