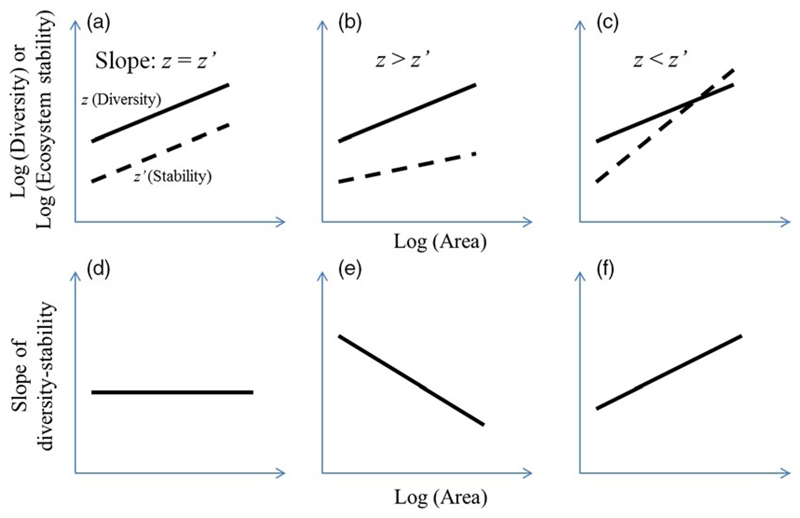
Figure 1.
Three scenarios leading to changes in diversity– and stability–area relationships, and the corresponding changes in the slopes of diversity–stability relationship. As both diversity (slope: z) and ecosystem stability (slope: z′) theoretically increase with area, three possible scenarios exist (i.e., constant, decrease, and increase) for the pattern of the diversity effect on ecosystem stability with increasing area. (a) Diversity has a similar slope to that of ecosystem stability (i.e., z = z′); (b) Diversity has a larger slope than that of ecosystem stability (i.e., z > z′); (c) Diversity has a smaller slope than that of ecosystem stability (i.e., z < z′). (d) The constant scenario: as shown in (a) (z = z′), the corresponding slopes of the diversity–stability relationship remain relatively constant; thus, the diversity–stability relationship is not influenced by an increase in area; (e) The decrease scenario: as shown in (b) (z > z′), the corresponding slopes of the diversity–stability relationship decrease as the area increases; thus, the effect of diversity on ecosystem stability weakens as the area increases; (f) The increase scenario: as shown in (c) (z < z′), the corresponding slopes of the diversity–stability relationship increase with increasing area; thus, the effect of diversity on ecosystem stability is enhanced with increasing area [Colour figure can be viewed at wileyonlinelibrary.com]

