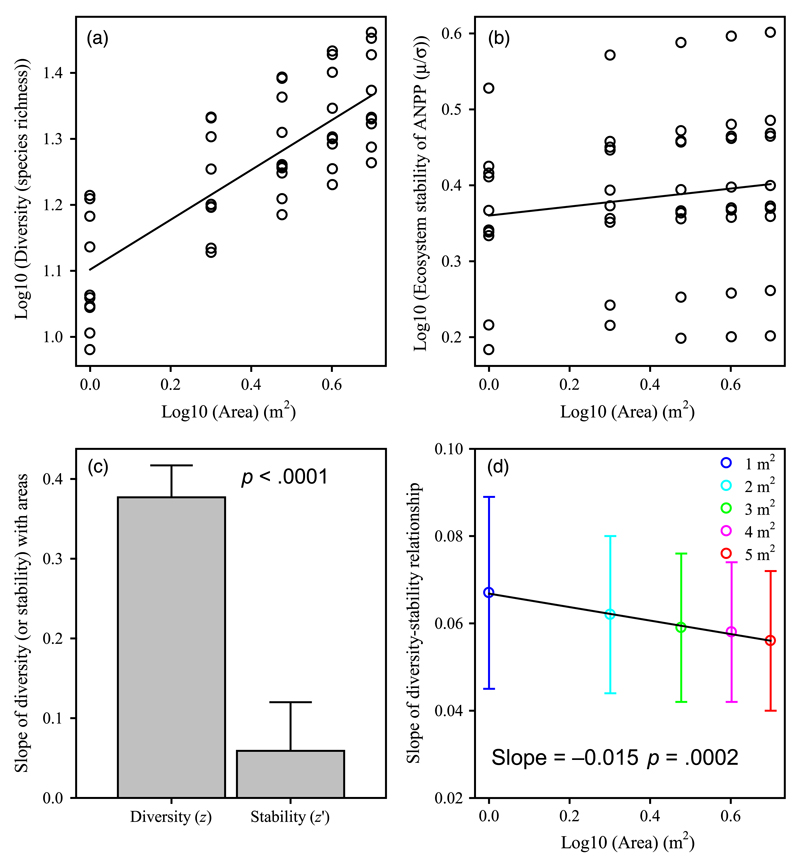
Figure 4.
Changes in the slopes between species richness and ecosystem stability with increasing area. (a) Species richness increased with areas. (b) Ecosystem stability did not alter with increasing area. (c) The slope of species richness vs. area (z = 0.377 ± 0.040) was significantly greater than that of ecosystem stability vs. area (z′ = 0.059 ± 0.061) (i.e., z > z′; F1,96 = 18.65, p < .0001; value of slope from a and b). (d) The slopes of species-richness–ecosystem-stability relationships declined with increasing area (data from Figure 2a; F1,3 = 441.00, p = .0002; R2 = .99), supporting our hypothesized decrease scenario (see Figure 1e); specifically, when z > z′, the corresponding slopes of the relationship between diversity and stability decrease with increasing area. When the area was not log-transformed, the linear regression was also significant (F1,3 = 36.21, p = .0092; R2 = .92; mean and 95% confidence intervals: −0.0030 [−0.0034 to −0.0026]). Error bars indicate 1 SE [Colour figure can be viewed at wileyonlinelibrary.com]

