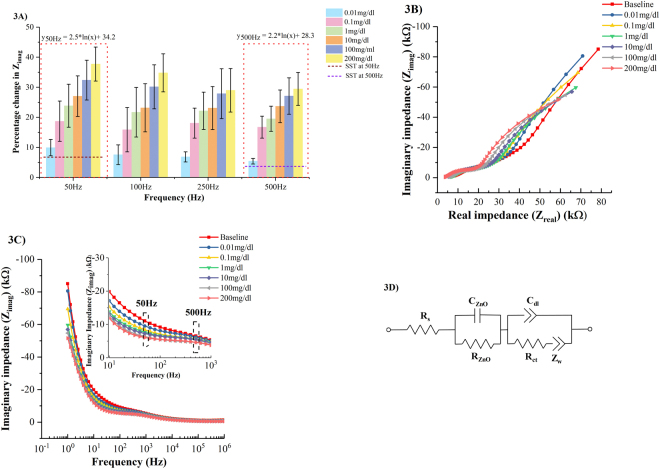
Figure 3.
(A) Calibration dose response of ethanol in human sweat as a function of percentage change in imaginary impedance (Zimag) (B) Nyquist plots for ethanol concentrations 0.01–200 mg/dl spiked in human sweat (pH ~5.98) (C) Bode magnitude plots for ethanol concentrations 0.01–200 mg/dl spiked in human sweat (pH ~5.98). Inset shows the bode magnitude plots over the frequency range 10–1KHz (D) Equivalent circuit representation of the ethanol detection sweat sensor system.

