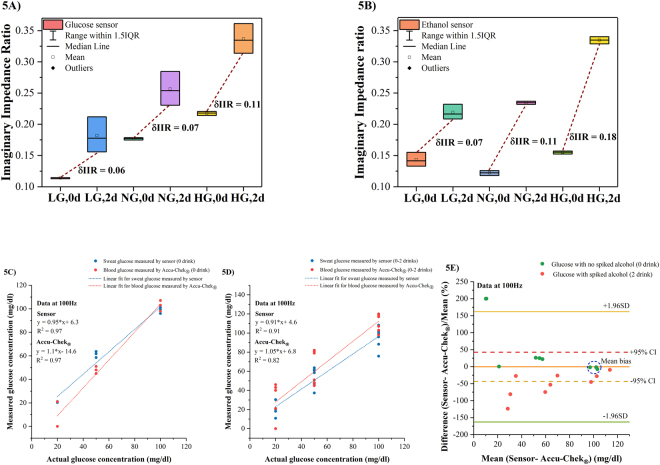
Figure 5.
(A) Box plots for combinatorial detection of glucose levels in the presence of alcohol (0–2 standard drinks) as an interferent in human sweat on a glucose sensor at 100 Hz (B) Box plots for combinatorial detection of alcohol (0–2 standard drinks) in the presence of glucose as an interferent in human sweat on an alcohol sensor at 100 Hz (C) Regression plot for human sweat glucose measured by the sweat sensor at 100 Hz and blood glucose measured by Accu-Chek® Nano SmartView glucose monitoring system in comparison to the actual glucose concentrations presented to them without alcohol (0 drink) (D) Regression plot for human sweat glucose measured by the sweat sensor at 100 Hz and blood glucose measured by Accu-Chek® Nano SmartView glucose monitoring system in comparison to the actual glucose concentrations presented to them with and without alcohol (0–2 drinks) (E) Bland- Altman analysis for sweat sensor at 100 Hz and Accu-Chek® for human sweat samples with varying glucose levels in the absence (0 drink) and presence of alcohol (2 drinks) at 100 Hz.

