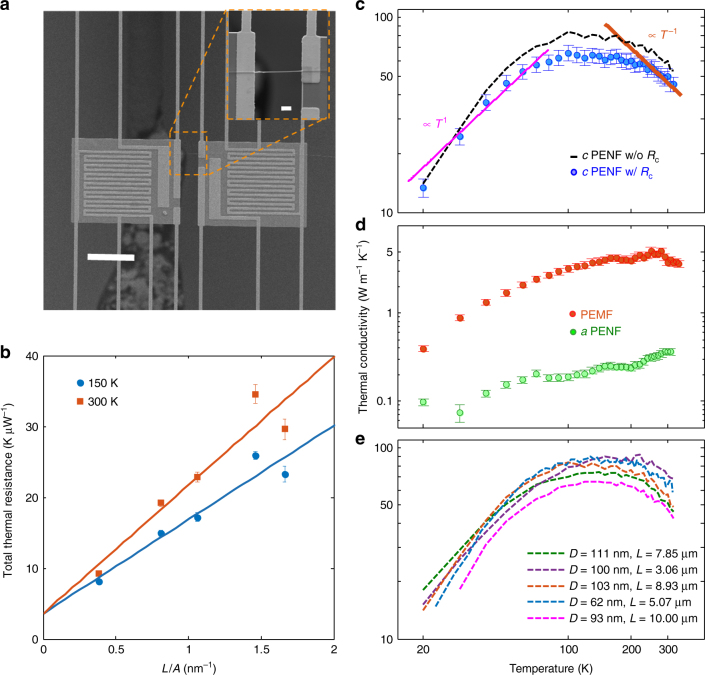
Fig. 3.
Thermal characterization of PENF. a A PRT based micro-device with the heating and the sensing islands. Inset shows a PENF bridging the islands. b Total measured thermal resistance vs. L/A of crystalline (c) PENFs at 150 K and 300 K where the y-intercept represents 2Rc. The error bars show the mean and standard deviation values of 250 measurements. c k(T) of a PENF. Blue circles are measured k of a c-PENF, black dotted lines are after adjusting for 2Rc. Orange line is 1/T trend of c-PENF at high temperatures and pink line is T1 trend at low temperatures. The error bars are obtained using error propagation in 2Rc and measured diameter (see Supplementary Note 4 for detailed uncertainty analysis). d k(T) of PEMF and amorphous (a) PENF. Red circles are PEMF before local drawing, and green circles are c-PENF amorphized due to exposure to FIB. e k(T) of all reported samples after adjusted for 2Rc. Scale bars, 20 µm and 2 µm (inset)

