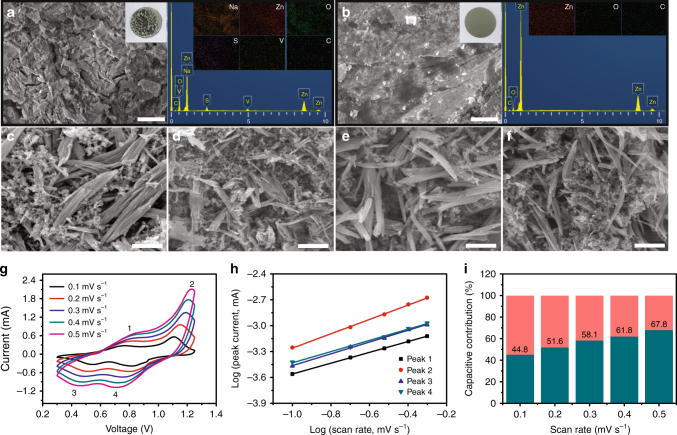
Fig. 4.
Morphology change of Zn negative electrode and NVO positive electrode after cycling and kinetics of electrochemical process. SEM images and corresponding EDS analysis of Zn negative electrodes (1 A g–1, 100th cycle) from Zn/NVO batteries based on a ZnSO4 and b ZnSO4/Na2SO4 electrolytes. Scale bars, 2 μm. SEM images of NVO electrodes at different states: c origin, d first discharged to 0.3 V, e first charged to 1.25 V, and f after 100 cycles at 0.1 A g–1 in ZnSO4/Na2SO4 electrolyte. Scale bars, 1 μm. g CV curves of NVO electrode at different scan rates in ZnSO4/Na2SO4 electrolyte and h the corresponding plots of log (peak current) vs. log (scan rate) at each peak. i The capacitive contributions at different scan rates in ZnSO4/Na2SO4 electrolyte

