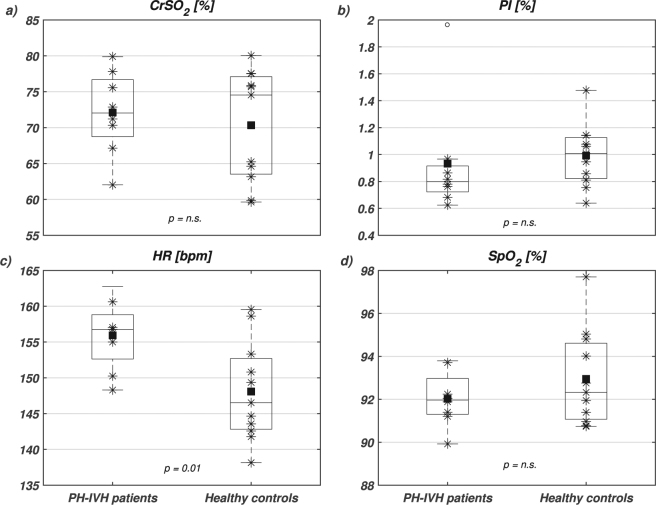
Figure 1.
Boxplots of (a) near infrared spectroscopy (NIRS) cerebral regional haemoglobin oxygen saturation (CrSO2), (b) peripheral perfusion index (PI), (c) heart rate (HR) and (d) capillary oxygen saturation (SpO2) in PH-IVH patients (left boxplots) and healthy age-matched controls (right boxplots). On each box, the central mark is the median, the square is the mean, the stars are the individual data, the edges of the box are the 25th and 75th percentiles, and the whiskers show the 95% confidence interval. Empty circles denote outliers and statistical comparisons are indicated with corresponding p-values (n.s., non-significant).

