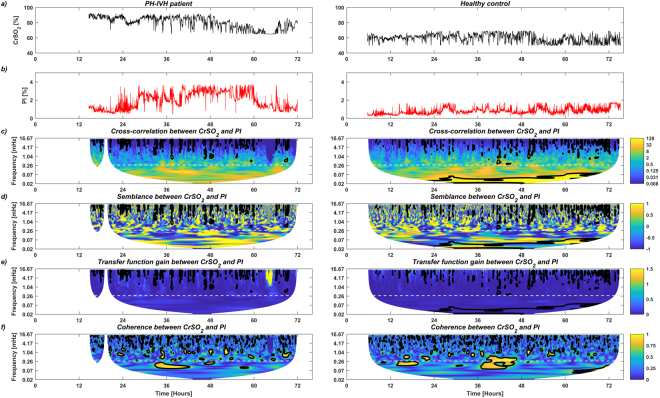
Figure 3.
Example of the complete analytical workflow in a healthy control (left column) and in an infant with pulmonary (PH) and/or intraventricular haemorrhage (IVH, right column): (a) and (b) depict temporal distributions of near infrared spectroscopy (NIRS) cerebral regional haemoglobin oxygen saturation (CrSO2) and peripheral perfusion index (PI) in the first 72 h of life, respectively; (c–f) display the amplitude of the cross-correlation, the semblance (anti-phase and in-phase), the amplitude of the gain (transfer function) and the coherence between CrSO2 and PI in the time-frequency space. Regions that are statistically significant are comprised in a black bold contour. A dashed white line indicates the selected ultra-frequency band of slow and prolonged periods of >1 h (<0.28 mHz) used for statistical analysis. Regions outside the cone of influence in which data are not used in the statistical analysis below are not shown.

