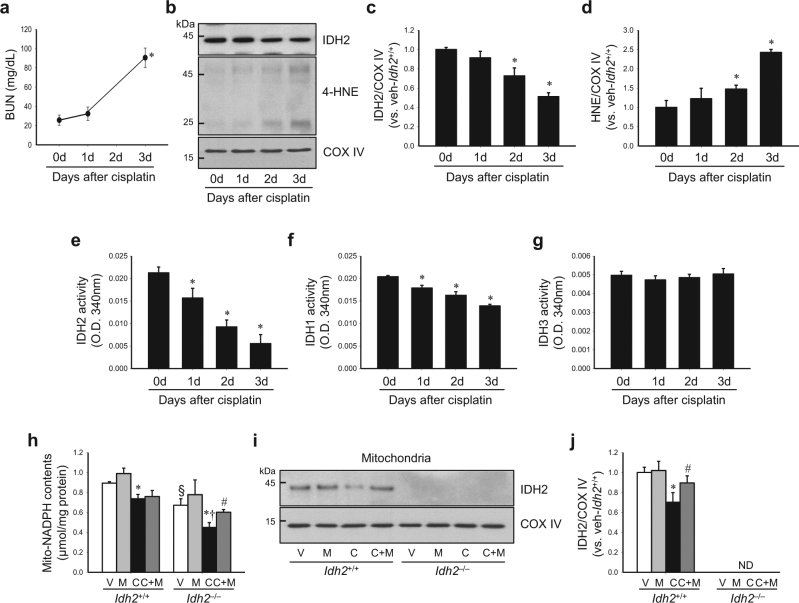
Fig. 3. Cisplatin administration decreases IDH2 expression and NADPH levels.
Idh2‒/‒ mice (h–j) and wild-type (Idh2+/+) littermates (a–j) were intraperitoneally injected with either cisplatin (C, 20 mg/kg B.W.) or 0.9% saline (vehicle, V) once. Some mice were treated with Mito-T (M, 0.7 mg/kg B.W.) daily, beginning 7 days before cisplatin injection and continuing until experiments were completed. Kidneys were harvested at the indicated time after cisplatin injection. a BUN concentration was determined at the indicated time (n = 4). b IDH2 and 4-HNE expression in mitochondrial fraction was determined by western blot analysis. c, d Band densities were measured by the ImageJ program. COX IV was used as loading control (n = 4). e–g Activities of IDH2 (e), IDH1 (f), and IDH3 (g) were measured in mitochondria fraction (e, g) and cytosol fraction (f), respectively (n = 4). h NADPH concentration in the kidney mitochondrial fraction was measured as described in the “Materials and methods” section. i Expression of IDH2 in mitochondrial fraction was detected by western blot analysis. j Band density was normalized to COX IV band using the ImageJ program. Results are expressed as means ± SE (n = 3–4 per group). *p < 0.05 vs. respective V; #p < 0.05 vs. respective C; §p < 0.05 vs. V in Idh2+/+; †p < 0.05 vs. C in Idh2+/+. ND non-detectable

