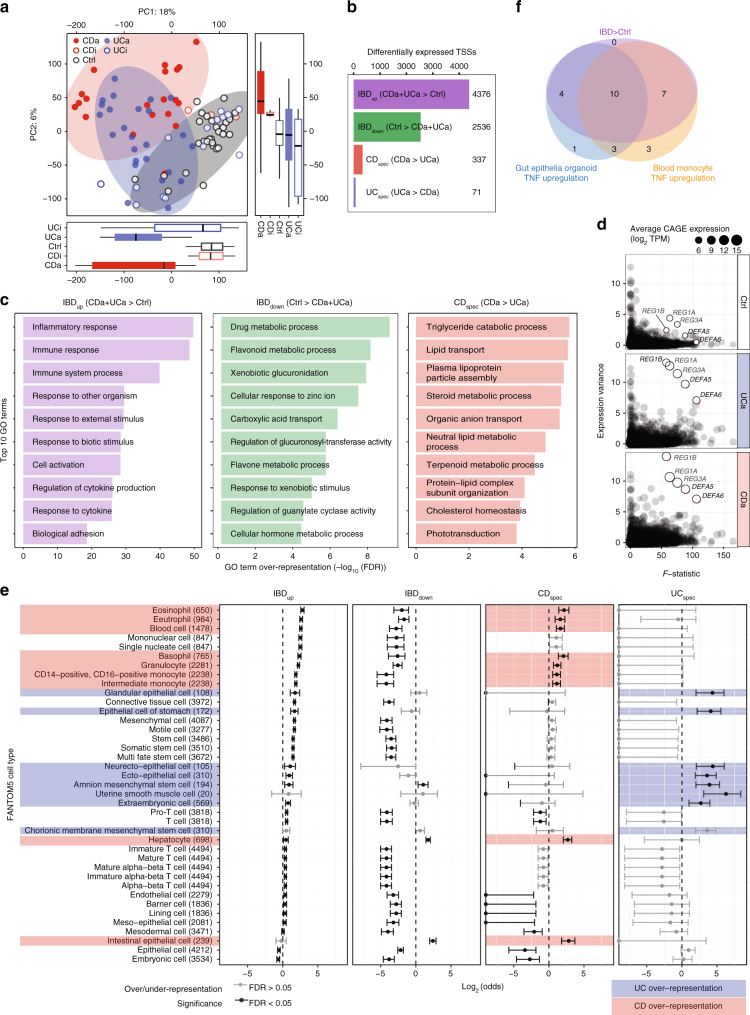
Fig. 2.
Differential expression of TSSs and genes in IBD. a Principal component analysis (PCA) based on CAGE TSS regions. X- and Y-axes show principal components (PCs) 1 and 2, percent of variance explained is indicated. Dots correspond to subjects, colored by group. Boxplots at the bottom and right show the distribution of PC. Circles show three major groups: CDa, UCa, and non-inflamed samples (UCi, CDi, and Ctrl). b Number of differentially expressed TSSs. Bar plot shows the number of differentially expressed TSSs in the four defined groups. c Gene ontology (GO) term overrepresentation analysis of differentially expressed genes. X-axis shows GO term overrepresentation FDR values on −log10 scale for differentially expressed genes in the IBDup, IBDdown, and CDspec sets. Y-axis shows the top 10 GO terms, ordered by FDR. d Identification of IBD-upregulated genes with extreme variance across IBD patients. Y-axis shows the variance of CAGE expression across CDa, UCa, and Ctrl subjects. X-axis shows the F-statistic from edgeR. Dots correspond to genes, where size indicates the average CAGE expression in respective group. Five outliers are highlighted, corresponding to antibacterial peptides. e FANTOM5 cell type enrichment of differentially expressed TSSs. Differentially expressed TSS sets were analyzed for overlap with TSSs specifically expressed in cell types in FANTOM5. X-axis shows under/over-representation of a given cell type expressed as log2(odds). Whiskers indicate 95% confidence intervals. Whiskers with black lines indicate statistical significance (Fisher’s exact test, FDR < 0.05). Cell types are ordered by their log-odds ratio in IBDup. Numbers in parentheses indicate the number of IBD-expressed TSSs specifically expressed in respective cell type in FANTOM5. Red shading shows cell types only enriched in CDspec TSSs, blue indicates cell types only enriched in UCspec TSSs. f Correspondence of TSSs upregulated in IBD with TSSs upregulated after TNF stimulation in epithelial organoids and blood monocytes. Venn diagram shows the number of TSSs (out of 36) upregulated in IBD (UCa or CDa vs. Ctrl), upregulated after TNF stimulation in gut epithelia organoids or blood monocytes, measured by qPCR. Upregulation after 4 and 24 h of TNF stimulation are pooled; see Supplementary Fig. 3c for time-specific measurements

