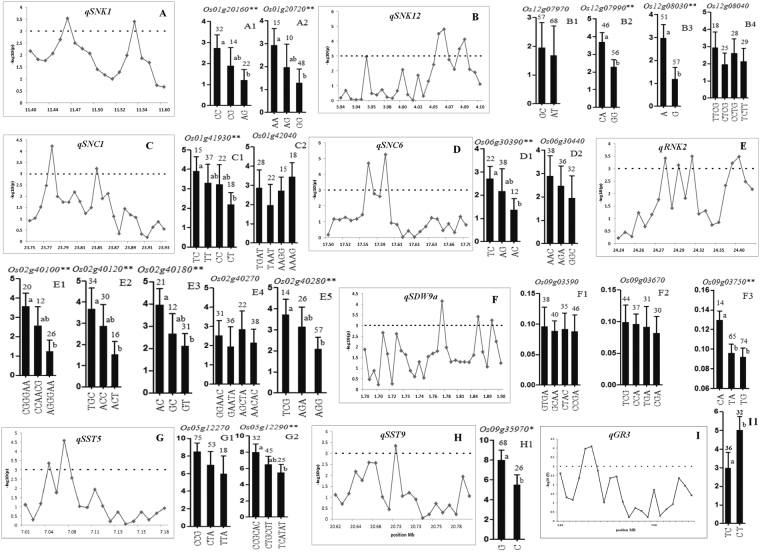
Figure 2.
Manhattan plot of important QTN and haplotype analysis of candidate genes. These genes are related to corresponding QTN including: analysis of candidate genes was done by using SAS general linear model approach qSNK1 (A), qSNK12 (B), qSNC1 (C), qSNC6 (D), qRNK2 (E), qSDW9a (F) qSST5 (G), qSST9 (H) and qGR3 (I). Each point was a gene in 200 kb region of the peak SNP of QTN. Dot line showed the threshold to determine candidate genes. The * and ** suggested significance of ANOVA at P < 0.05 and 0.01. The letter on histogram (a and b) indicated multiple comparisons result at the significant levels 0.05 and 0.01. The value on top of histogram was the number of individuals for each haplotype and histogram length shows the mean value of these individuals for each haplotype

