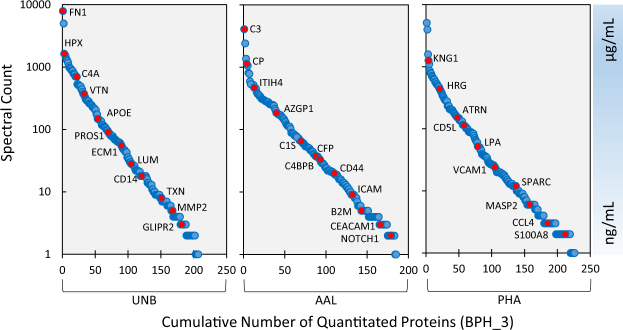
Figure 2.
Depth of Proteomic Analysis – the above figure plots the spectral count (per protein) against the cumulative number of quantitated proteins ordered from highest to lowest spectral count (by unique gene name). Examples of the types of proteins that were quantitated are highlighted in red for reference. Literature values of concentrations for these proteins were used to estimate the dynamic range of the protein mixture. This plot was generated from a single, representative sample with an average number of protein identifications. Across all M-LAC fractions, 315 proteins were quantitated in this sample.

