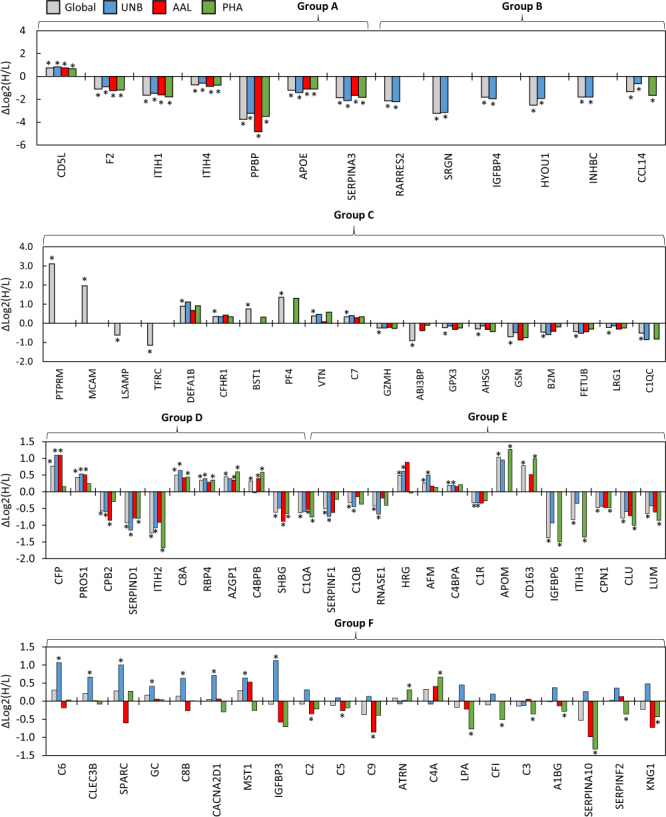
Figure 4.

Difference in mean (Δ = log2H/L_PCa − log2H/L_BPH) plotted by M-LAC fraction per protein. Asterisk denotes a statistically significant difference in mean (p ≤ 0.05). Proteins are grouped by expression patterns: (A) Quantitated in all fractions and significantly different in all fractions; (B) Significantly different in every M-LAC fraction it was quantitated in; (C) Only significant at the global protein level; (D) Significantly different in multiple M-LAC fractions; (E) Significantly different in only one M-LAC fraction and at the global protein level; (F) Significantly different in one M-LAC fraction and not at the global protein level.
