Figure 6.
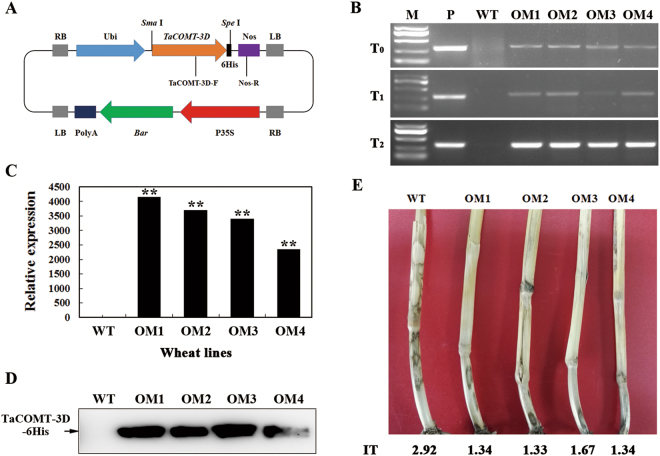
Molecular characterizations of TaCOMT-3D-overexpressing wheat plants and responses to Rhizoctonia cerealis infection. (A) The diagram of TaCOMT-3D overexpressing transformation vector pWMB-TaCOMT-3D. (B) PCR pattern of TaCOMT-3D-overexpressing transgenic lines in T0-T2 generations and wild-type (WT) wheat Yangmai 16 using the primers specific to TaCOMT-3D-Tnos cassette. M, DL2, 000 DNA marker; P, the transformation vector pWMB-TaCOMT-3D as a positive control. (C) qRT-PCR analyses of the relative transcript levels of TaCOMT-3D in TaCOMT-3D transgenic lines at 7 d post inoculation (dpi) with R. cerealis. Three biological replicates per line were averaged and statistically treated (t-test; **P < 0.01). Bars indicate standard deviation of the mean. (D) Western blot pattern of the four TaCOMT-3D-overexpressing transgenic lines and WT Yangmai 16 using an anti-6 × His antibody. Similar results were obtained from three independent replicates. (E) Typical symptoms of sharp eyespot in the four TaCOMT-3D-overexpressing transgenic and WT Yangmai 16 plants.

