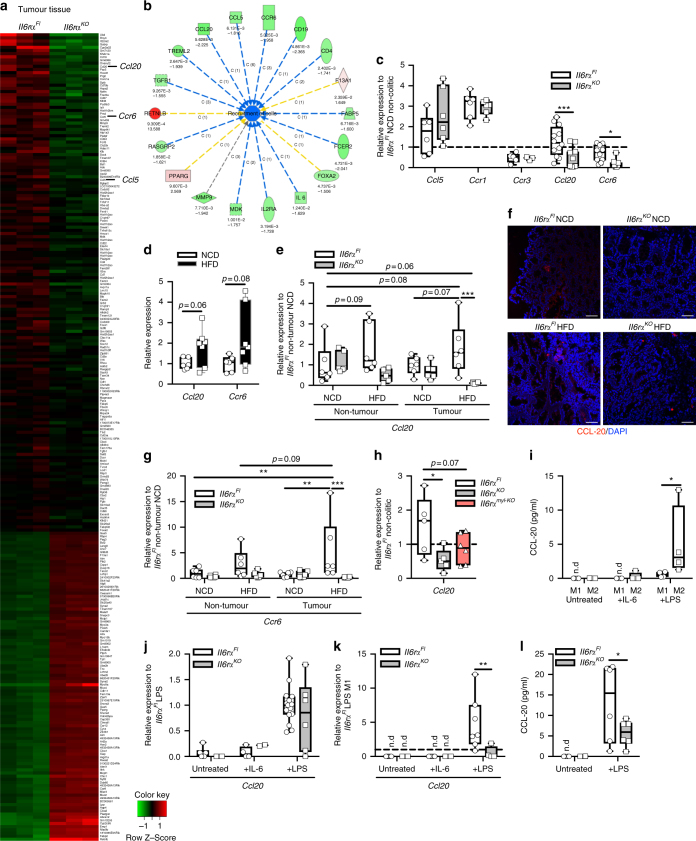
Fig. 3.
IL-6-polarised M2 macrophages express CCL-20. a Heat map of differently expressed transcripts in tumours derived from 17-week-old HFD-fed Il6rαFl versus Il6rαKO mice at day 62 of the 1.5% AOM/DSS protocol, assessed with a cutoff of a change in expression of 1.5-fold and p-value ≤ 0.025. b IPA analysis diagram of downregulated (green) and upregulated (red) cell recruitment factors in tumour tissues derived from 17-week-old HFD-fed Il6rαFl versus Il6rαKO mice at day 62 of the 1.5% AOM/DSS protocol. Upper number represent respective p-value, lower number fold change. c qPCR analysis of indicated gene expression in tumours of 17-week-old HFD-fed Il6rαFl versus Il6rαKO (n = 6–12) at day 62 of the 1.5% AOM/DSS protocol, results are presented relative to non-colitic NCD Il6rαFl colons at day 0. d qPCR analysis of indicated gene expression in distal colons of 8-week-old NCD (n = 6) and HFD (n = 7) fed C57BL/6 mice. e qPCR analysis of Ccl20 expression in non-tumour tissue and tumours of 17-week-old NCD and HFD-fed Il6rαFl and Il6rαKO mice (n = 6) at day 62 of the 1.5% AOM/DSS protocol, results are presented relative to NCD Il6rαFl non-tumour at day 62. f Representative immunofluorescent stainings of CCL-20 (red) expression in colons of 17-week-old NCD and HFD-fed Il6rαFl and Il6rαKO mice at day 62 of the 1.5% AOM/DSS protocol. g qPCR analysis of Ccr6 expression in non-tumour tissue and tumours of 17-week-old NCD and HFD-fed Il6rαFl and Il6rαKO mice (n = 6) at day 62 of the 1.5% AOM/DSS protocol, results are presented relative to NCD Il6rαFl non-tumour at day 62. h qPCR analysis of Ccl20 gene expression in F4/80 MACS-purified macrophages from colitic colons of 10-week-old NCD-fed Il6rαFl, Il6rαKO and Il6rαmyl-KO (n = 6) at day 13 of the 1.5% AOM/DSS protocol, results are presented relative to macrophages F4/80 MACS sorted from non-colitic Il6rαFl colons. i CCL-20 produced by M1- and M2-polarised BMDM from control mice (n = 4) stimulated 24 h with IL-6 or LPS as examined by ELISA. qPCR analysis of Ccl20 gene expression in j M1 (n = 4–15) or k M2 (n = 7)-polarised BMDM stimulated with IL-6 or LPS for 8 h from Il6rαFl and Il6rαKO mice, results are presented relative to LPS-stimulated Il6rαFl M1. l CCL-20 produced by M2-polarised BMDM stimulated 36 h with LPS from Il6rαFl and Il6rαKO mice (n = 6) as examined by ELISA. AOM, azoxymethane; DSS, dextran sodium sulphate; NCD, normal chow diet; HFD, high-fat diet; IPA, Ingenuity pathway analysis; MACS, magnetic-activated cell sorting; BMDM, bone marrow-derived macrophages; n.d., not determined. centre line: median; box limits: 1st and 3rd quartiles; whisker: maximum to minimum, *p ≤ 0.05, **p ≤ 0.01 and ***p ≤ 0.001 two-tailed unpaired Student’s t-test d, one-way h or two-way ANOVA followed by Fisher LSD c, e, g, i, j, k, l. Scale bar, 50 μm

