Fig. 2.
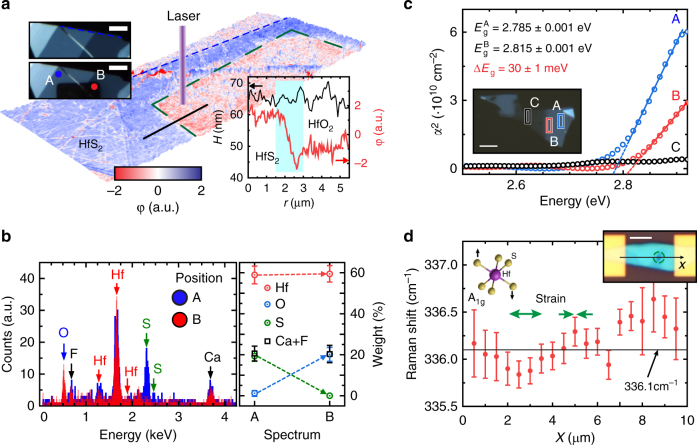
Photo-oxidation and strain engineering in HfS2. a AFM topography with phase contrast φ signal superimposed of a representative flake after laser exposure (green-dashed line). Top-left inset: optical micrograph of the flake before (top) and after (bottom) laser-assisted oxidation. Bottom-right inset: height (H) and phase signal along a 5 μm line-cut (black line). Scale bars are 5 μm. b EDXMA spectra acquired in the regions A and B in panel a and quantitative analysis of the chemical elements (right). c Square of the absorption coefficient (α2) of: (A) HfS2 away and (B) close to the oxidised area and (C) HfO2. Extrapolated direct bandgap: = 2.785 ± 0.001 eV and = 2.815 ± 0.001 eV, ΔEg = 30 ± 1 meV. Inset: optical micrograph of the flake where the colour boxes represent the sampling areas (1 × 3 μm) in which the absorption spectra where acquired. Spectrum (B) is centred at 1 μm from the edge of the oxide area. Scale bar is 4 μm. d Frequency of the A1g mode of HfS2 as a function of position along the photo-engineered device shown in the inset (green circle indicates the photo-oxidised area). The horizontal solid line marks the average frequency of an as-fabricated flake at 336.1 cm−1, tensile (compressive) strain is marked by a down- (up-) shift of this mode (green arrows). Error bars represent the uncertainty of the Lorentzian fit of the spectra. Scale bar is 3 μm

