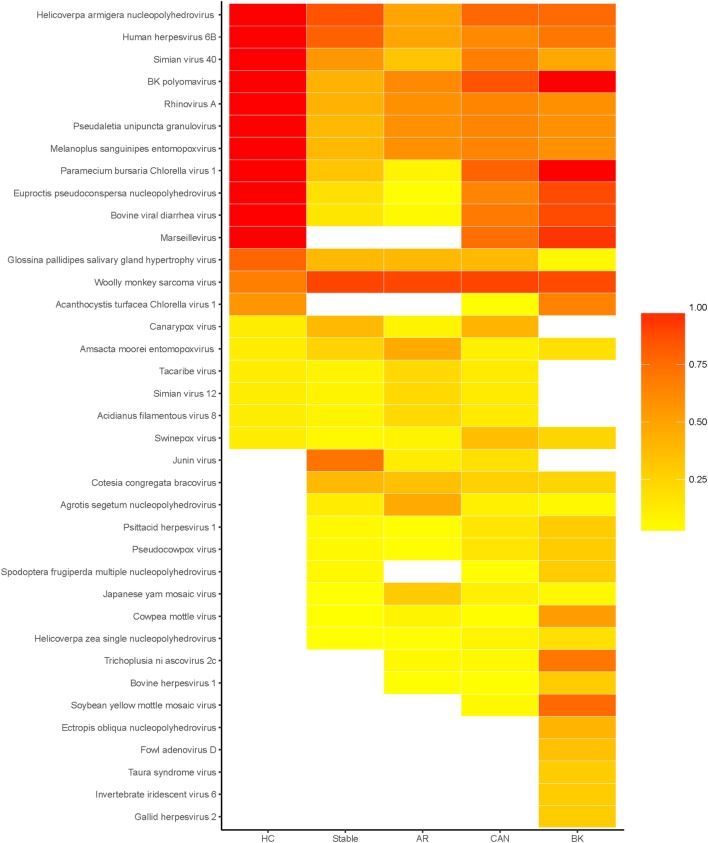
Figure 2.
Heatmap of prevalence by disease status. Heatmap of the percentage of patients, within each disease status, in which each virus was detected. Total number of unique viruses in each disease status: healthy control (HC) 20, stable 27, acute rejection (AR) 28, chronic allograft nephropathy (CAN) 32, and BK 32.

