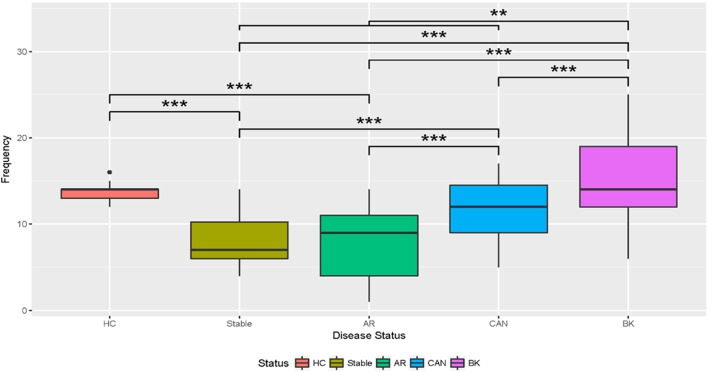
Figure 3.
Boxplots of the number of unique viruses discovered by disease status. The boxplots show that the relative abundance of unique viruses discovered in stable and acute rejection (AR) patients is lower than the number discovered in healthy control (HC). The number of viruses discovered increased in chronic allograft nephropathy (CAN) above stable and AR. The number of viruses increased in BK over all immunosuppressed categories. T-Tests with Bonferroni corrections were used for multiple testing. *Significant at p < 0.05; **significant at p < 0.005; ***significant at p < 0.001.

