
FIGURE 2.
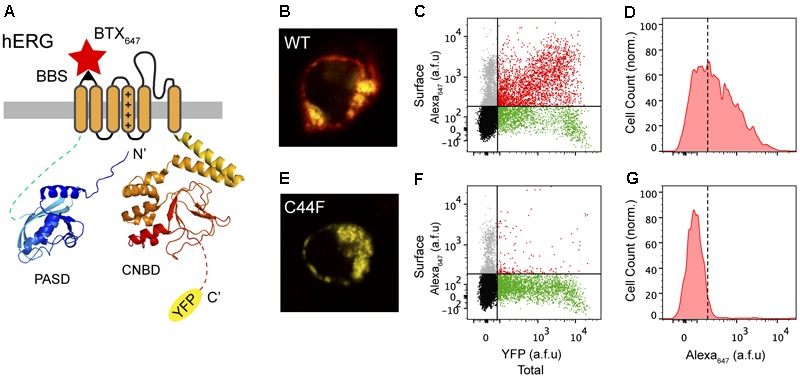
Surface labeling of hERG channels. (A) Cartoon of BBS-hERG-YFP subunit. PASD (blue) and CNBD (red) structures adapted from Wang and MacKinnon (2017) (PDB: 5VA2). The bungarotoxin binding site (BBS) epitope (S1-S2) allows for selective labeling of surface hERG channels while YFP signal represents total hERG protein expression. (B) Confocal image of a live cell expressing BBS-hERG-YFP and stained with BTX647. (C) Flow cytometry dot plot showing surface (BTX647 fluorescence) and total (YFP fluorescence) hERG expression in cells expressing BBS-hERG-YFP. Vertical and horizontal lines represent thresholds for YFP and BTX647-positive cells, respectively, based on the analyses of single color controls. Represented are YFP-positive cells with BTX647 signal above (red dots) or below threshold (green dots); BTX647-positive cells with YFP signal below threshold (gray dots); and untransfected cells (black dots). (D) Histogram of BTX647 fluorescence in cells expressing WT BBS-hERG-YFP, generated from population of YFP-positive cells. Dotted line is threshold value for BTX647 signal. (E–G) Data for cells expressing LQT2 mutant BBS-hERGC44F-YFP channels; same format as B–D.