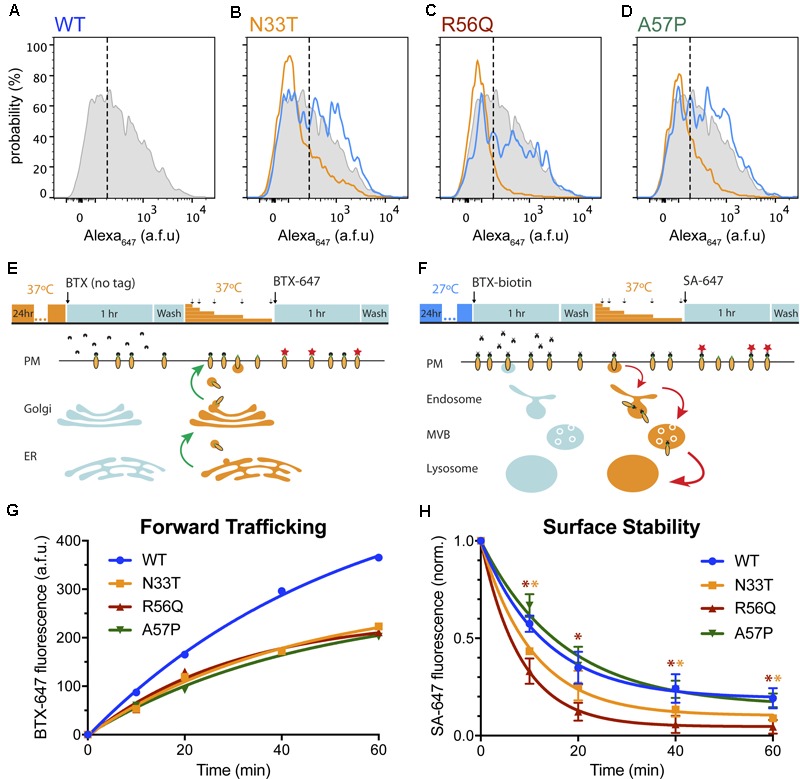
FIGURE 4.

LQT2 hERG channels with WT glycosylation patterns show reduced surface expression. (A–D) Representative histograms representing surface intensity from HEK293 cells expressing BBS- and YFP-tagged (A) WT HERG (gray) at 37°C, and LQT2 mutants (B) N33T, (C) R56Q, and (D) A57P incubated at 37°C (orange) and 27°C (blue). (E) Schematic adapted from Kanner et al. (2017), showing optical pulse-chase assay for measuring BBS-hERG-YFP forward trafficking. Cells expressing BBS-hERG-YFP were incubated at 37°C for 24 h prior to the experiment. BBS-tag on channels initially at the cell surface was blocked by incubation with untagged α-bungarotoxin (BTX) at 4°C. Cells were washed and placed back at 37°C for varying time intervals (10, 20, 40, 60 min) to resume delivery of new channels to the surface membrane. Newly delivered channels were labeled with Alexa Fluor 647 conjugated BTX (BTX647) at 4°C and analyzed using flow cytometry. (F) Time evolution of BBS-hERG-YFP delivery to the surface for WT ( , n = 7312–8016 cells; N = 2), N33T (
 , n = 6886–7533 cells; N = 2), R56Q (
 , n = 7756–9248 cells; N = 2), A57P (
 , n = 9159–10139 cells; N = 2). Smooth curves are fits of an exponential growth function to the data: y=A(1-e-t/τ). For WT (
 ), A = 560.7 ± 47.5, τ = 53.6 ± 9.5 min; N33T (
 ), A = 293.1 ± 42.2, τ = 42.2 ± 12.3 min; R56Q (
 ), A = 248.6 ± 35.5, τ = 30.4 ± 10.4 min; A57P (
 ), A = 276.2 ± 40.0, τ = 44.5 ± 12.6 min. (G) Schematic adapted from Kanner et al. (2017), showing optical assay for measuring BBS-hERG-YFP stability at the cell surface. Cells expressing BBS-hERG-YFP were incubated at 27°C for 24 h prior to the experiment. Channels initially at the cell surface were labeled with biotin-conjugated BTX (BTX-biotin) at 4°C. Cells were washed and incubated at 37°C for varying time intervals (10, 20, 40, 60 min) to allow for internalization of surface channels. The remaining surface channels were labeled with Alexa Fluor 647-conjugated streptavidin (SA-647) at 4°C. (H) Time evolution of loss of surface BBS-hERG-YFP channels WT (
 , n = 8184–10128 cells; N = 3), N33T (
 , n = 8499–10175 cells; N = 3), R56Q (
 , n = 9460–12338 cells; N = 3), A57P (
 , n = 7123–8911 cells; N = 3). Smooth curves are fits of an exponential decay function to the data: y=(1-A)e-t/τ+A. For WT (
 ), A = 0.19 ± 0.02, τ = 12.9 ± 0.9 min; N33T (
 ), A = 0.10 ± 0.02, τ = 10.6 ± 0.8 min; R56Q (
 ), A = 0.05 ± 0.004, τ = 8.2 ± 0.2 min; A57P (
 ), A = 0.15 ± 0.05, τ = 16.5 ± 3.2 min.
  and
and  , p < 0.05 for N33T and R56Q, respectively, compared to WT; two-way ANOVA followed by Dunnett’s test.
