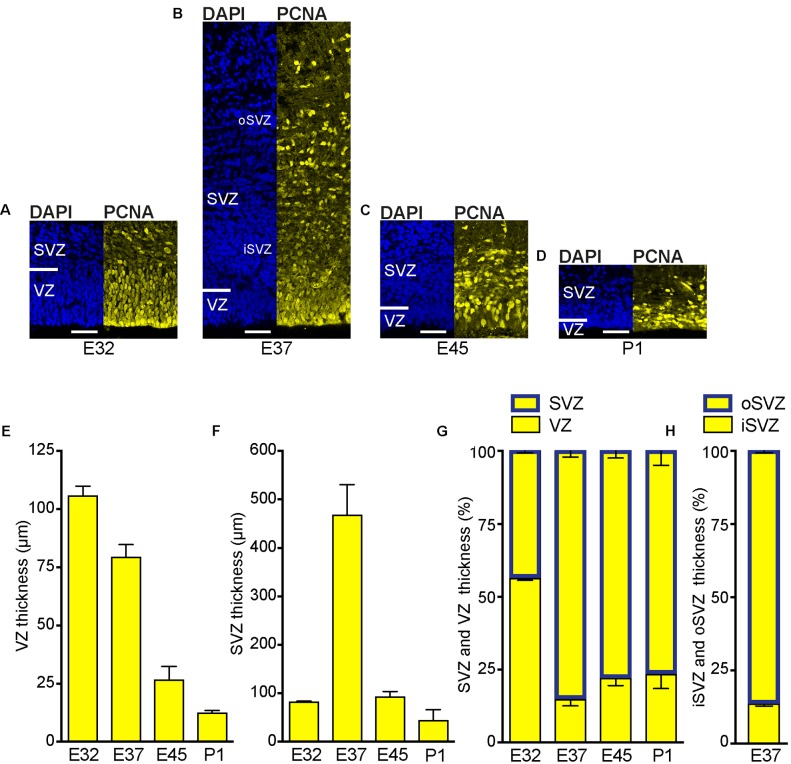
FIGURE 2.
Development of the germinal zones in the tree shrew neocortex. (A–D) Immunofluorescence for PCNA (yellow) and DAPI staining (blue) on 30 μm-cryosections of E32–P1 tree shrew neocortex. The top margin of the image corresponds to the transition zone SVZ/intermediate zone. Scale bars, 50 μm. VZ, ventricular zone; SVZ, subventricular zone; iSVZ, inner SVZ; oSVZ, outer SVZ. (E) Quantification of the VZ thickness of the E32–P1 tree shrew neocortex. (F) Quantification of the SVZ thickness of the E32–P1 tree shrew neocortex. (G) Quantification of the VZ and SVZ thickness of the E32–P1 tree shrew neocortex, expressed as percentage of the sum of VZ and SVZ. (H) Quantification of the iSVZ and oSVZ thickness of the E37 tree shrew neocortex, expressed as percentage of the sum of iSVZ and oSVZ. (E–H) Data represent mean ± SD and were obtained from two consecutive sections of two brains each.

