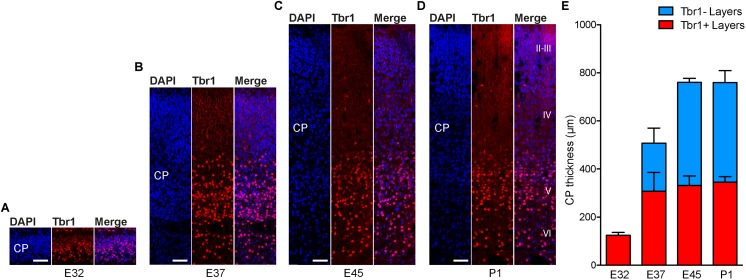
FIGURE 3.
Cortical plate development in the tree shrew neocortex. (A–D) Immunofluorescence for Tbr1 (red) and DAPI staining (blue) on 30 μm-cryosections of E32–P1 tree shrew neocortex. The bottom margin corresponds to the transition zone CP/subplate. Cortical layers II–VI are indicated in (D). Scale bars, 50 μm. CP, cortical plate. (E) Quantification of the thickness of Tbr1+ and Tbr1– CP layers in the E32–P1 tree shrew neocortex. Data represent mean ± SD and were obtained from consecutive two sections of two brains each.

