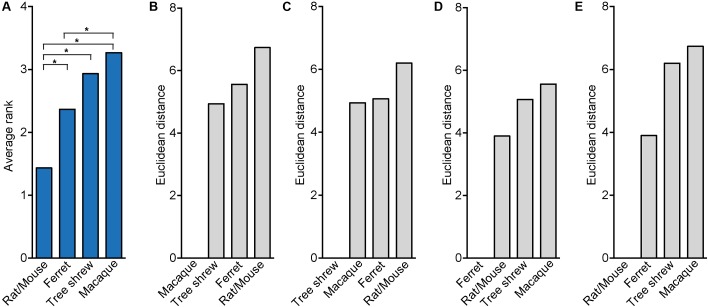
FIGURE 7.
Rank test and Euclidean distance computation illustrating the relationship between tree shrew, macaque, ferret and rat/mouse neocortex development. (A) Bar plot showing the average ranks, which were obtained over all neurodevelopmental parameters of tree shrew, macaque, ferret and rat/mouse (Table 2). Statistical differences between the average ranks of the different species were tested with the Kruskal–Wallis-test followed by Conover’s post hoc test using Holm correction. Asterisks indicate significant P-values (P < 0.05). (B–E) Bar plots by Euclidean distance computation using z-transformed values of distinct parameters of tree shrew, macaque, ferret and rat/mouse neocortex development (Table 2). (A–E) For details, see Section “Materials and Methods.”

