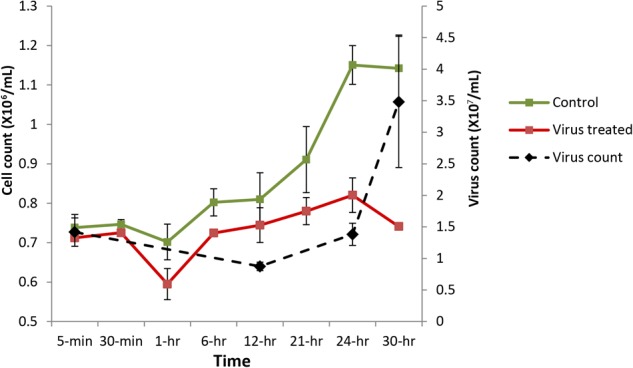
FIGURE 1.

Aureococcus and AaV count over the course of infection. Cell counts are average of three biological replicates, while virus counts are average of two biological replicates. Green, cell count in control cultures; red, cell counts in infected cultures; and black, virus counts.
