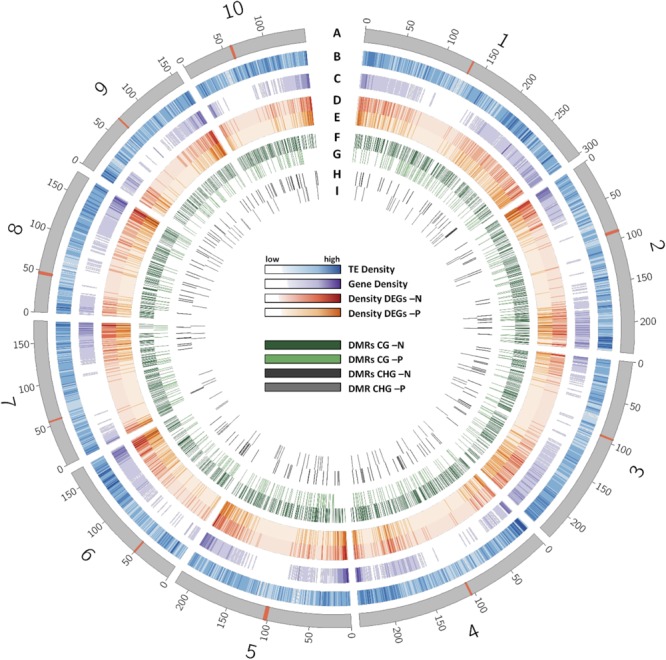
FIGURE 4.

Distribution of different features across the chromosomes of the B73 genome. (A) Chromosomes with their centromere shown as red band. (B) Density of transposable elements. (C) Density of genes. (D) Density of DEGs in -N. (E) Density of DEGs in -P samples. (F) Distribution of CG DMRs in -N samples. (G) Distribution of CG DMRs in -P samples. (H) Distribution of CHG DMRs in -N samples. (I) Distribution of CHG DMRs in -P samples.
