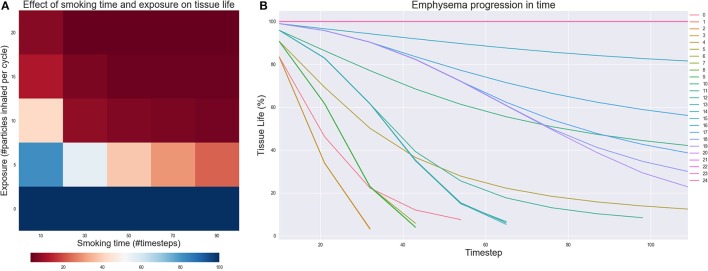
Figure 5.
(A) Effect of changing the number of particles inhaled for each simulated smoking (exposure) and the total time of the simulation spent smoking (Smoking time). The value of each cell is the residual tissue life in % after the simulation stopped. (B) Emphysema progression in time. The parameters of the experiments are in figure (A): starting from experiment 0 in the lowest left corner to experiment 24 in the upper right.

