Figure 3.
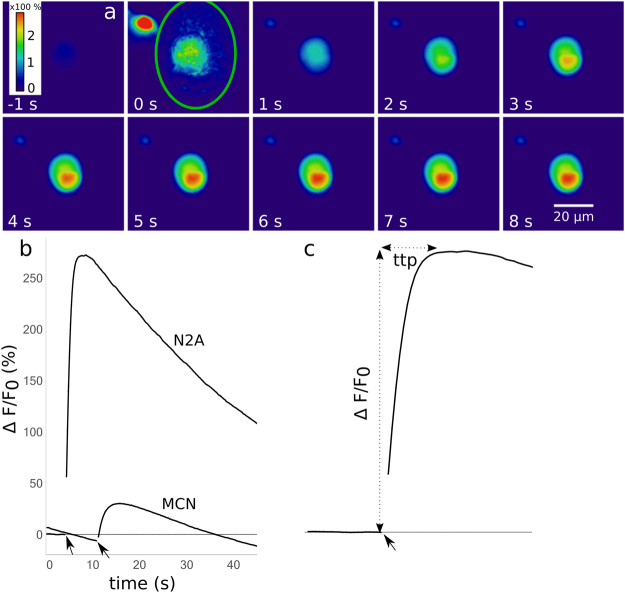
(a) Image series of a cell undergoing laser stimulation. The stimulus was placed at 0 s, and images were recorded at 5 fps. The green line at 0 s outlines the laser spot. A second cell (red spot at 0 s) was located in the vicinity of the spot, but not evaluated. The sequence shows the Fluo 4 intensity 1 s before the stimulus and up to 8 s afterwards. Fluorescence increase (%) is color coded. Maximum fluorescence was reached after approx. 6 s. (b) Representative depictions of the most frequently observed calcium signatures in N2A cells and MCN, respectively. Arrows indicate where the laser stimulus was placed. The respective frame was excluded from quantification, resulting in a gap in the graphs. (c) Illustration of the measurements taken for quantitative evaluation. Maximum increase in fluorescence (ΔF/F0) was measured relative to the fluorescence values before laser stimulation. Time to peak (ttp) was defined as the time in s from the laser pulse to the peak value.

