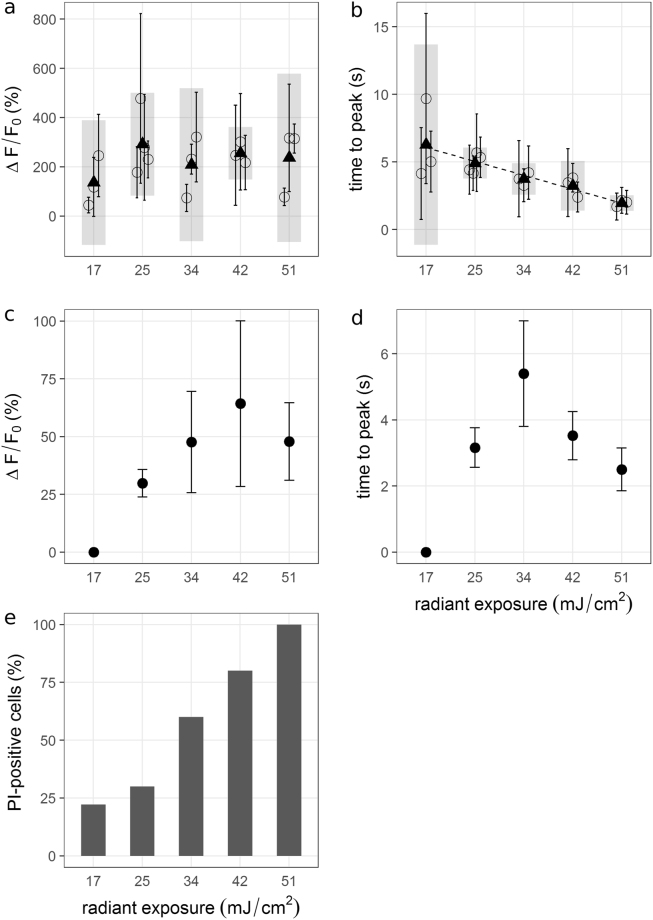
Figure 4.
∆F/F0 and ttp values from N2A (a,b) and MCN (c,d) versus radiant exposure. (a,b) Mean values and standard deviations were calculated for each experiment with n = 10 cells (circles + error bars). Black triangles are averages of the respective means per radiant exposure and grey bars are the associated 95%-confidence intervals. While there is no visible trend in ∆F/F0 values, time to peak decreased with increasing radiant exposure. (c,d) Mean values and standard deviations were calculated from one experiment with n = 10 cells. Larger values for radiant exposure tended to yield larger peak fluorescence values, but also resulted in larger variation. Time to peak values do not show a clear trend. MCN were not activated at 17 mJ/cm². (e) The proportion of PI-positive N2A cells (pooled) increased with radiant exposure.

