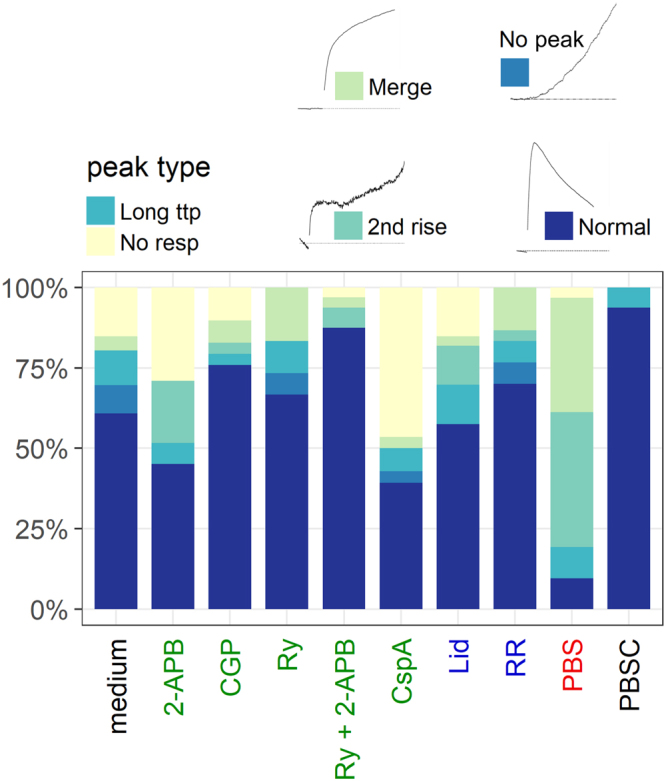
Figure 6.

Summary of different calcium signatures in N2A cells by condition. Label colors refer to the targeted mechanism of calcium transport (see Fig. 2). Representative depictions of the different calcium signatures are shown for reference. Long ttp describes cells for which the time to peak did not fall in the respective experiment’s interquartile range and that were therefore categorized as outliers. Under certain conditions, the normal calcium signature was observed less frequently. In PBS, 77.5% of cells showed either a merge or a second rise. 46% of cells in CspA exhibited no response.
