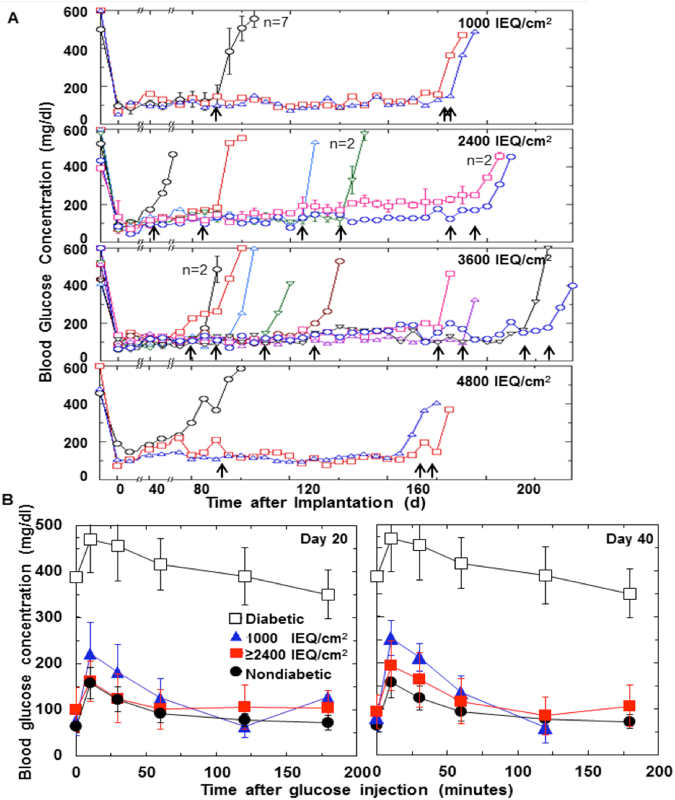
Figure 4.
Long-term function of implanted devices with islets encapsulated at various surface densities. (A) Blood glucose concentration plotted versus time after implantation. βAir devices implanted with about 2,400 IEQ at surface densities of about 1,000, 2,400, 3,600, and 4,800 IEQ/cm2 into streptozotocin-induced diabetic rats. Data from devices with 1,000 IEQ/cm2, which were replenished with atmospheric air, are from an earlier study10 and are shown for comparison. Data for other devices, which were replenished with gas mixtures having initial pO2 shown in Table 1, are taken from the experiments plotted in the upper right domain of Fig. 5A, for which IEQ ≥ 7350 and OCR ≥ 2425. Blood glucose concentration for each symbol represents mean of non-fasting measurements over 5 d taken at 7 am and 4 pm each day (total of 10 measurement for each animal). On day 0, insulin sustained-release capsules were removed. (Data for blood glucose immediately after implantation of these capsules not shown). Thirty devices electively explanted from 42 to 229 d after implantation, indicated by arrows, all but one of which were normoglycemic at time of explantation. n = 2 or higher designates multiple devices treated identically, the results of which were averaged. (B) Intravenous glucose tolerance test (IVGTT) performed on day 20 and day 40 following implantation. Data summarized for diabetic rats (n = 28), non-diabetic rats (n = 52), and diabetic rats having device implanted with different surface densities (n = 66). Latter group included all animals that were normoglycemic for 8 weeks or more. IVGTT data plotted for animals having devices with about 1,000 IEQ/cm2 and for combined data for devices with 2,400, 3,600, and 4,800 IEQ/cm2. For surface densities of about 1,000 IEQ/cm2, day20: 0 to 120 min (n = 9), 0 to 180 min (n = 1); day 40: 0 to 120 min (n = 9), 0 to 180 min (n = 0). For 2,400, 3,600, and 4,800 IEQ/cm2, respectively, 0 to 180 min, day 20: n = 27, 19, and 8; day 40: n = 26, 15, and 5.

