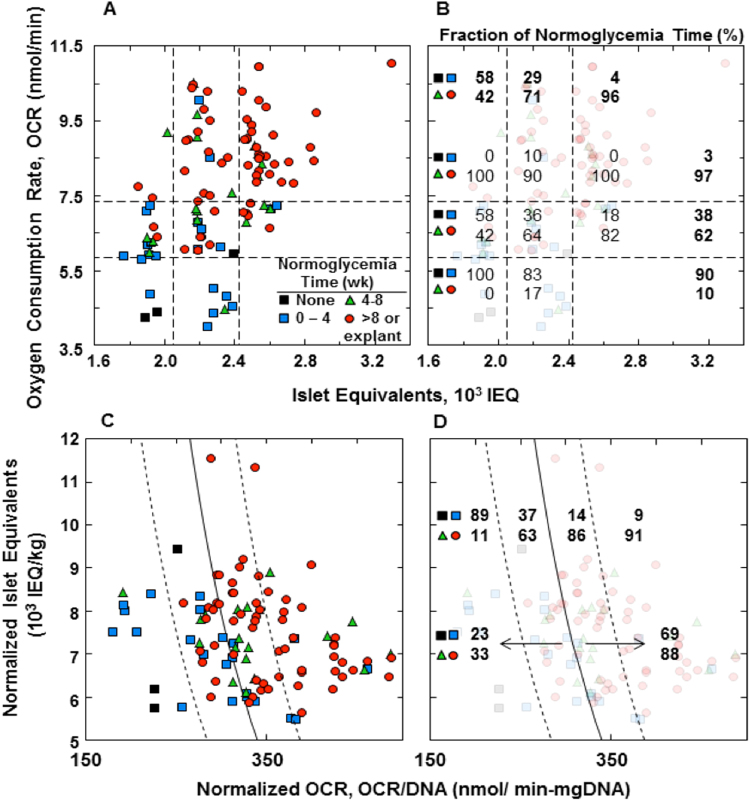
Figure 5.
Relationship between normoglycemia time and islet parameters of animals for which pre-implant data is available. Time period during which normoglycemia was maintained: (1) none, (2) >0–4 wk, (3) 4–8 wk, and (4) 8 wk or explantation while still normoglycemic. (A) Datum point for each animal plotted at its corresponding OCR and number of IEQ. Data field is segregated into nine regions defined by IEQ ≤ 2050, 2050 ≤ IEQ ≤ 2425, and 2425 ≤ IEQ; OCR ≤ 5850, 5850 ≤ OCR ≤ 7350, and 7350 ≤ OCR. (B) Fraction of normoglycemia times <4 wk (top two symbols) and >4 wk (bottom two symbols) indicated within each region. Average for each row and column is also tabulated in bold. (C) Same data as in (A) plotted on coordinates of IEQ/kg and OCR/DNA. DNA content was calculated using 1,560 cells/IEQ13 and 6.5 mg DNA/cell17. Solid curve was fitted to data for naked transplantation of rat islets into mice18, given by log10 y = ax + b, where y = IEQ/kg, x = OCR/DNA in nmol/min mg DNA, a = 0.00515 DNA/OCR, and b = 5.45. Dashed lines to left and right of fitted curve are 68% confidence limits associated with fitted curve. (D) Same as (C), with the fraction of normoglycemia time <4 wk (top) and >4 wk (bottom) indicated for each region.

