
FIGURE 3.
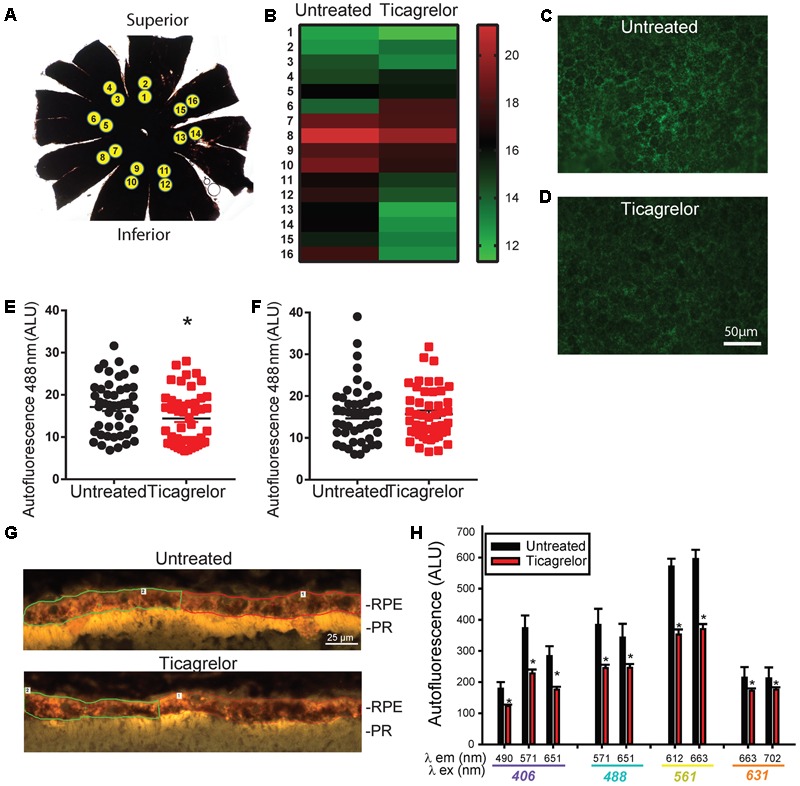
Ticagrelor reduces autofluorescence in RPE cells from ABCA4-/- mice. (A) A RPE whole mount preparation indicating the location of images obtained for autofluorescence quantification. (B) Heat map illustrating variation in intensity of autofluorescence (488 nm ex/>525 nm em) in regions corresponding to those in “A.” Each band is the mean of six untreated mice or mice treated with 0.1% ticagrelor in food for 28 days. Scale at right shows relative intensity. Images of autofluorescence excited at 488 nm in inferior regions of RPE wholemounts from untreated (C) and treated (D) ABCA4-/- mice. (E) Autofluorescence intensity from regions 9–16 of six mice in each condition (p = 0.039, n = 48 measurements; eight from each mouse). (F) Autofluorescence intensity from regions 1–8 of six mice in each condition, n = 48). Mice were 257–333 days old after ticagrelor treatment. (G) Images from sections of the outer retina showing the RPE and photoreceptor outer segments (POSs) in untreated 20 month old ABCA4-/- mice at 406 nm ex/>409 nm em. The demarcation of two regions of interest (ROI) in the RPE layer are shown. Analogous image for 20 month old ABCA4-/- mouse treated with 10 μg/ml ticagrelor in drinking water for 4 days. (H) Mean autofluorescence output for key excitation/emission pairs wavelengths (λ, as indicated; ∗p < 0.05, n = 16 untreated, 10 treated sections from 4 to 5 mice respectively).