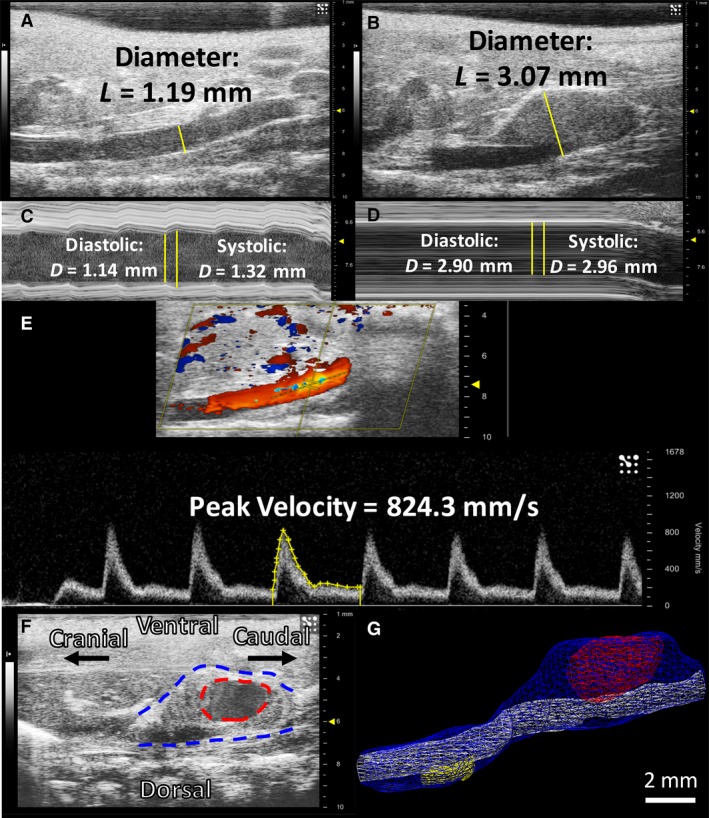
Figure 1.

Sample 2D and 3D ultrasound images and analysis. 2D B‐mode images shown with example linear measurements placed perpendicular to the vessel walls in healthy (A) and aneurysmal (B) mice. 2D M‐mode images show cursor placement and example systolic and diastolic measurement tracings in a healthy (C) and diseased (D) aorta. The dotted line cursor for PW images runs parallel to the aorta, and a sample velocity waveform tracing is shown in yellow (E). A 2D long‐axis B‐mode image of an aneurysm is shown on the left (F) with a volumetric representation of this aneurysm shown on the right (G). The blue surface is the overall AAA volume, the white surface is the true lumen volume, the red represents the open‐false lumen near the renal arteries, and the yellow is a closed lumen from a more cranial lesion. The hypoechoic region on the B‐mode image confirms the open‐false lumen volume depicted in (G; dotted red line). This volumetric acquisition further demonstrates the benefits of 3D imaging for complex aortic dissections with multiple lesions.
