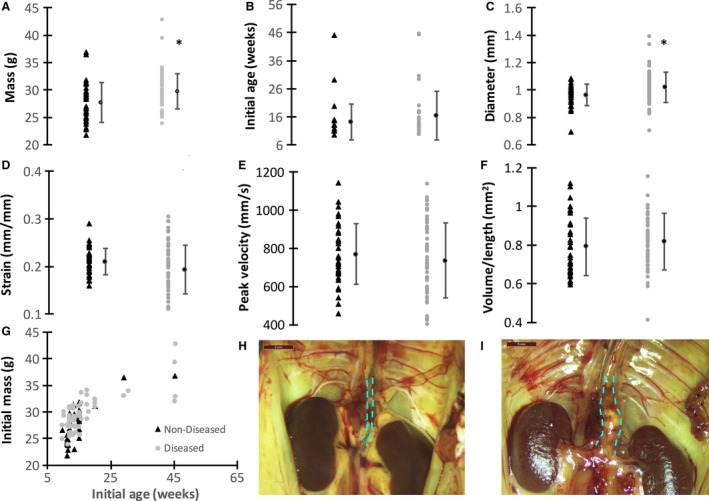
Figure 3.

Baseline suprarenal aortic US measurements compared between groups. Both nondiseased (black triangle) and diseased (gray circles) are plotted from individual animals with means for each group shown as black circles (A–F). No significant differences were observed between groups except for body mass and initial mean diameter (*P ≤ 0.01). As expected, body mass was correlated with age for both the nondiseased and diseased groups (G). Example nondiseased (H) and aneurysmal (I) suprarenal aortas are shown at day 28 after sacrifice. Dashed cyan lines highlight the suprarenal abdominal aorta where AngII‐induced aneurysms form immediately proximal to the renal arteries. The aneurysmal aorta shows a dissection bulging to the animal's left. Scale bars: 5 mm. These plots represent the negligible differences between individual metrics for diseased and nondiseased animals, prompting the need for a statistical model to better delineate between the groups.
