
Figure 4.
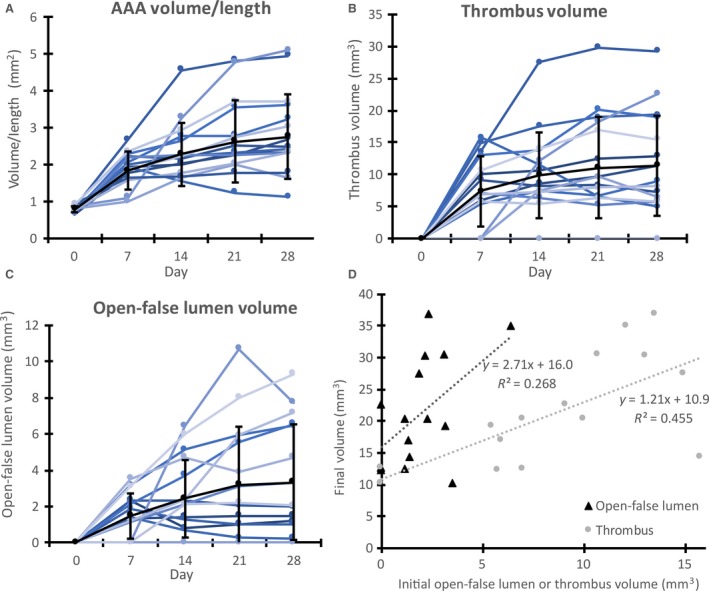
Aneurysm growth from volumetric analysis of the total AAA, open‐false lumen, and intramural thrombus. Volume data are shown for days 0 through 28 of total dissecting AAA volume/length (A) and also for thrombus volume (B) and open‐false lumen volume (C) within the aneurysmal false lumen. Each line represents an individual mouse. Day 0 represents measurements at baseline, prior to AngII infusion. Black lines show means ± SD. Initial (or diagnosis day) open‐false lumen and thrombus average volumes show a positive trend when plotted with respect to final dissecting AAA volume (D). These plots show how the composition of an aneurysm may influence the growth of a dissecting AAA over time.