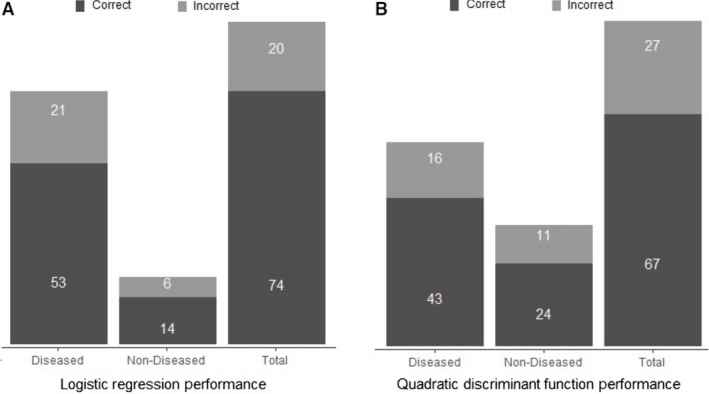
Figure 8.

Numbers of mice predicted correctly in the diseased group, nondiseased group, and overall for the logistic regression model (A) and quadratic discriminant analysis model (B). These data highlight the ability of the prediction model to determine an animal's risk of developing a dissecting AAA or aortic rupture based only on baseline measurements.
