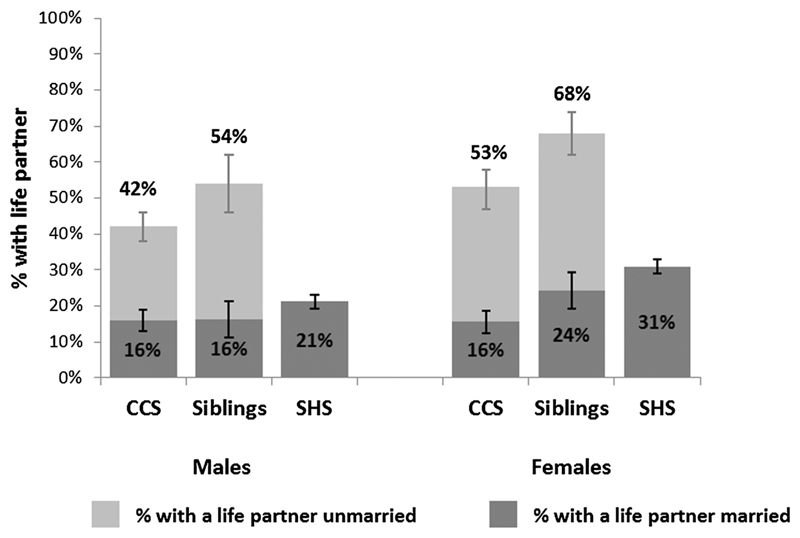
Fig. 2.
Proportions with a life partner in CCS and comparison groups stratified by gender with 95% confidence intervals. The numbers on top of the bars represent the total proportion with a life partner (married and unmarried). Sibling and SHS population are standardized on age, gender, migration background, and language region according to the CCS population. Data for being unmarried with a life partner were not available for the SHS population.

