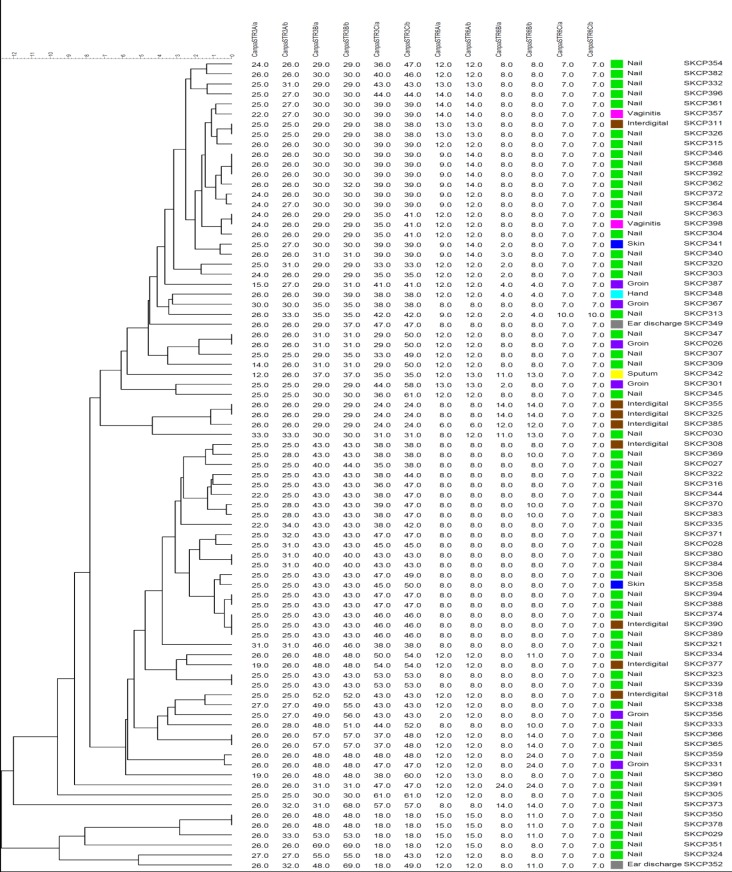
Figure 1.
Dendrogram showing genotypic diversity among 81 clinical C. parapsilosis isolates obtained from Iran. The scale bar indicates the percentage similarity between the genotypes. The columns after the short tandem repeat patterns represent the source of isolates and isolate number, respectively.

