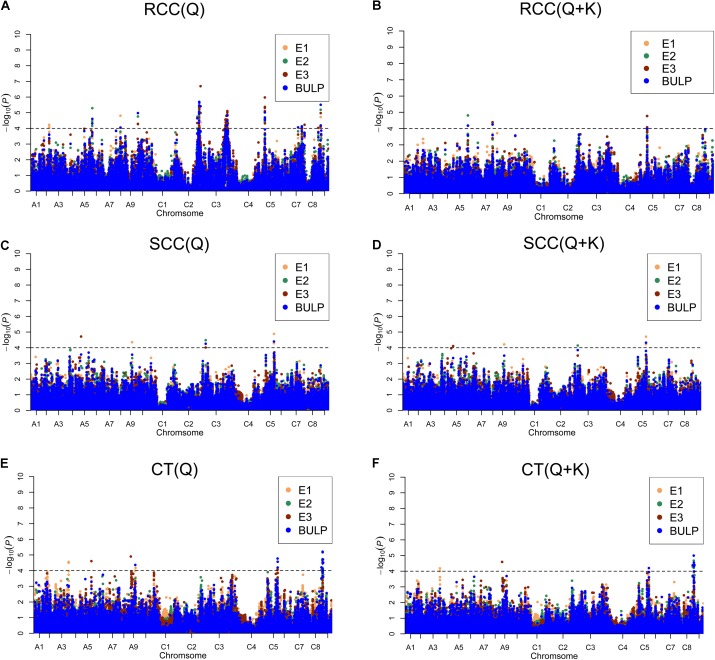
FIGURE 3.
Manhattan plots generated from genome-wide association analysis results for Cd accumulation traits using Q and Q + K models. (A) RCC (Q). (B) RCC (Q + K). (C) SCC (Q). (D) SCC (Q + K). (E) CT (Q). (F) CT (Q + K). E1, greenhouse in 2013; E2, greenhouse in 2014; E3, natural environment condition in 2014; BLUP, best linear unbiased prediction values. Gray horizontal line depicts significantly threshold (P < 0.0001).

