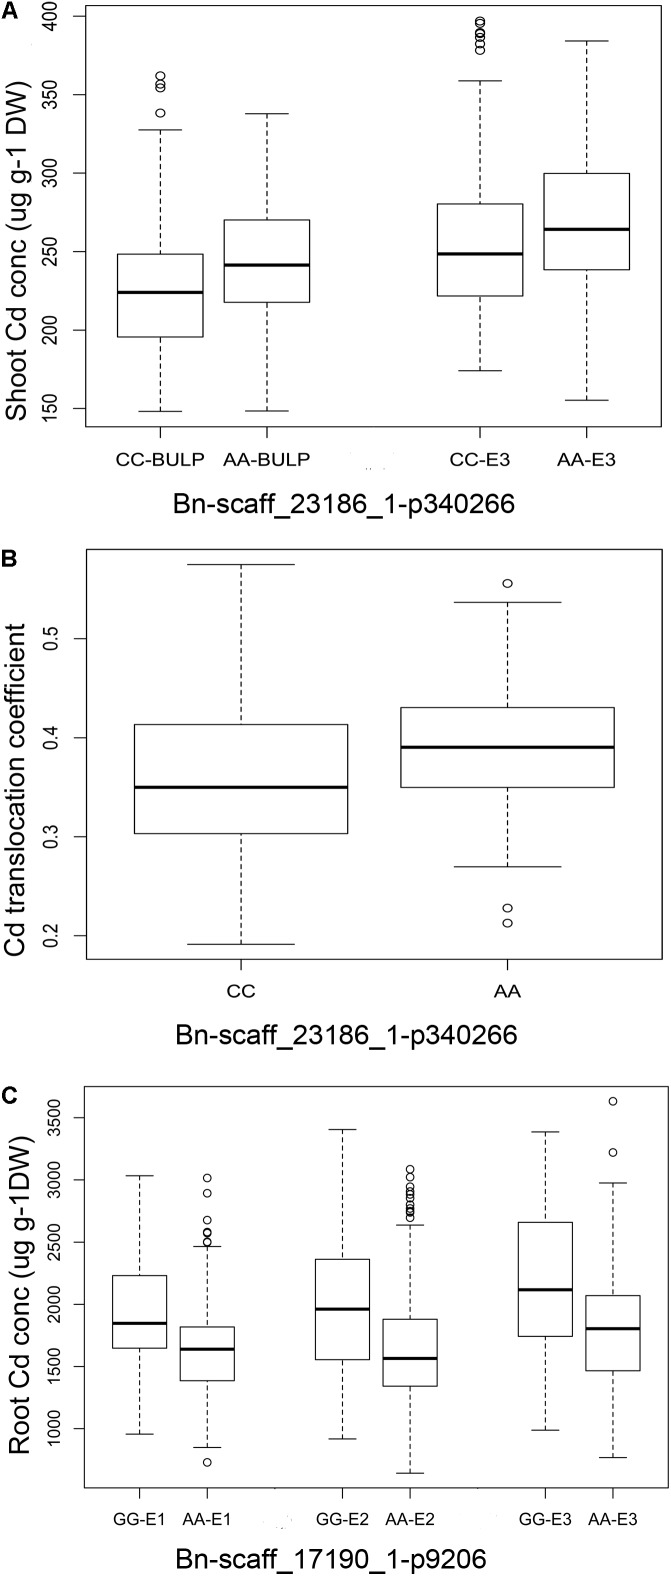
FIGURE 4.
Phenotypic differences between lines with different alleles of the SNPs associated with Cd accumulation traits in three growth environments. (A) Bn-scaff_23186_1-p340266 associated with root Cd concentration in E1 (P < 0.001) and BLUP (P < 0.0001). (B) Bn-scaff_23186_1-p340266 associated with Cd translocation coefficient in E1 (P < 0.0001). (C) Bn-scaff_17190_1-p9206 associated with root Cd concentration in three environments (all P < 0.0001).

