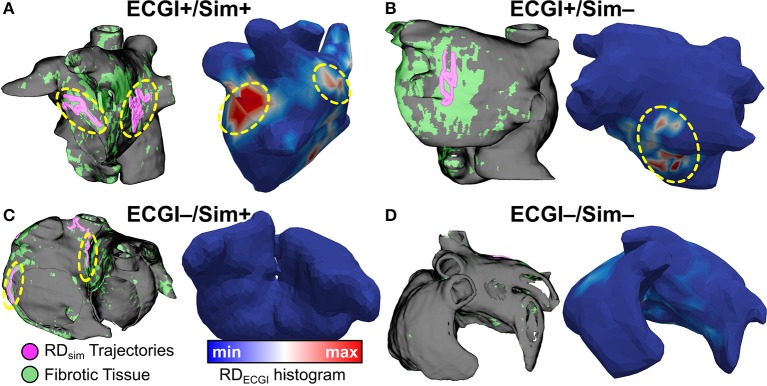
Figure 7.
ECGI+/Sim+, ECGI+/Sim−, ECGI−/Sim+, and ECGI−/Sim− region examples. RD trajectories in regions of interest for each panel are highlighted by dashed yellow circles. (A) (patient 1): matching RD sites in both left PV and posterior LA regions. (B) (patient 2): RDECGI site in posterior LA region was not observed during simulations. (C) (patient 4): RDsim sites in inferior RA and inter-atrial groove were not observed during clinical mapping via ECGI. (D) (patient 11): Superior RA and anterior LA regions were free of RD activity in both simulations and ECGI. See Figure 5 for legend.

