FIGURE 1.

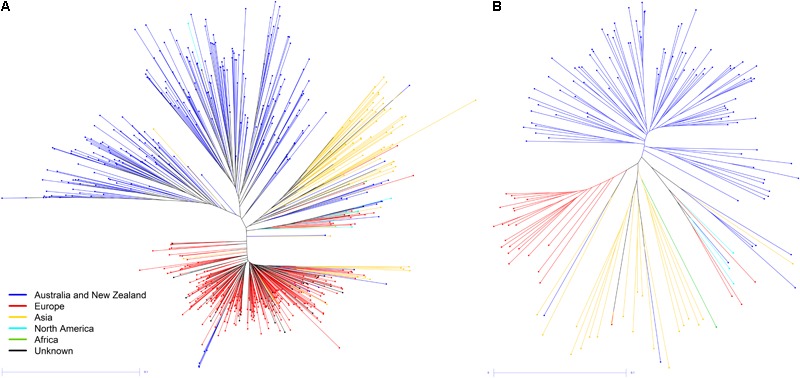
NJ tree calculated using Nei’s pairwise genetic distance for (A) GBS-t data set of 633 samples and (B) WGR data set of 149 samples.

NJ tree calculated using Nei’s pairwise genetic distance for (A) GBS-t data set of 633 samples and (B) WGR data set of 149 samples.