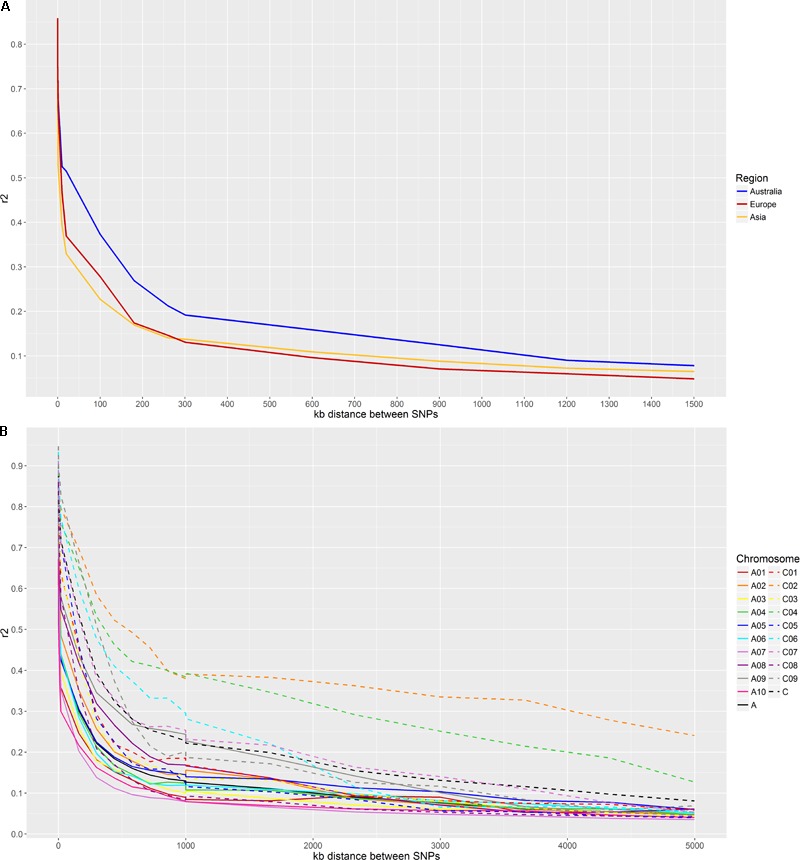
FIGURE 3.

(A) LD decay based on GBS-t data. LD is examined in three major growing regions: Australia, Europe, and Asia. (B) LD decay based on WGR data for individual chromosomes. The A genome chromosomes are represented by solid lines and the C genome chromosomes are represented by dashed lines. The discontinuity at 1000 kb is an artifact of the binning process.
